Welcome to myHomeScout
myHomeScout is a property evaluation tool designed to help with comparing and analysing properties in Sydney. Properties can be tracked, reference points can be set for important locations, and travel times can be visualised to make informed decisions.
Application Layout
The application is divided into four main sections:
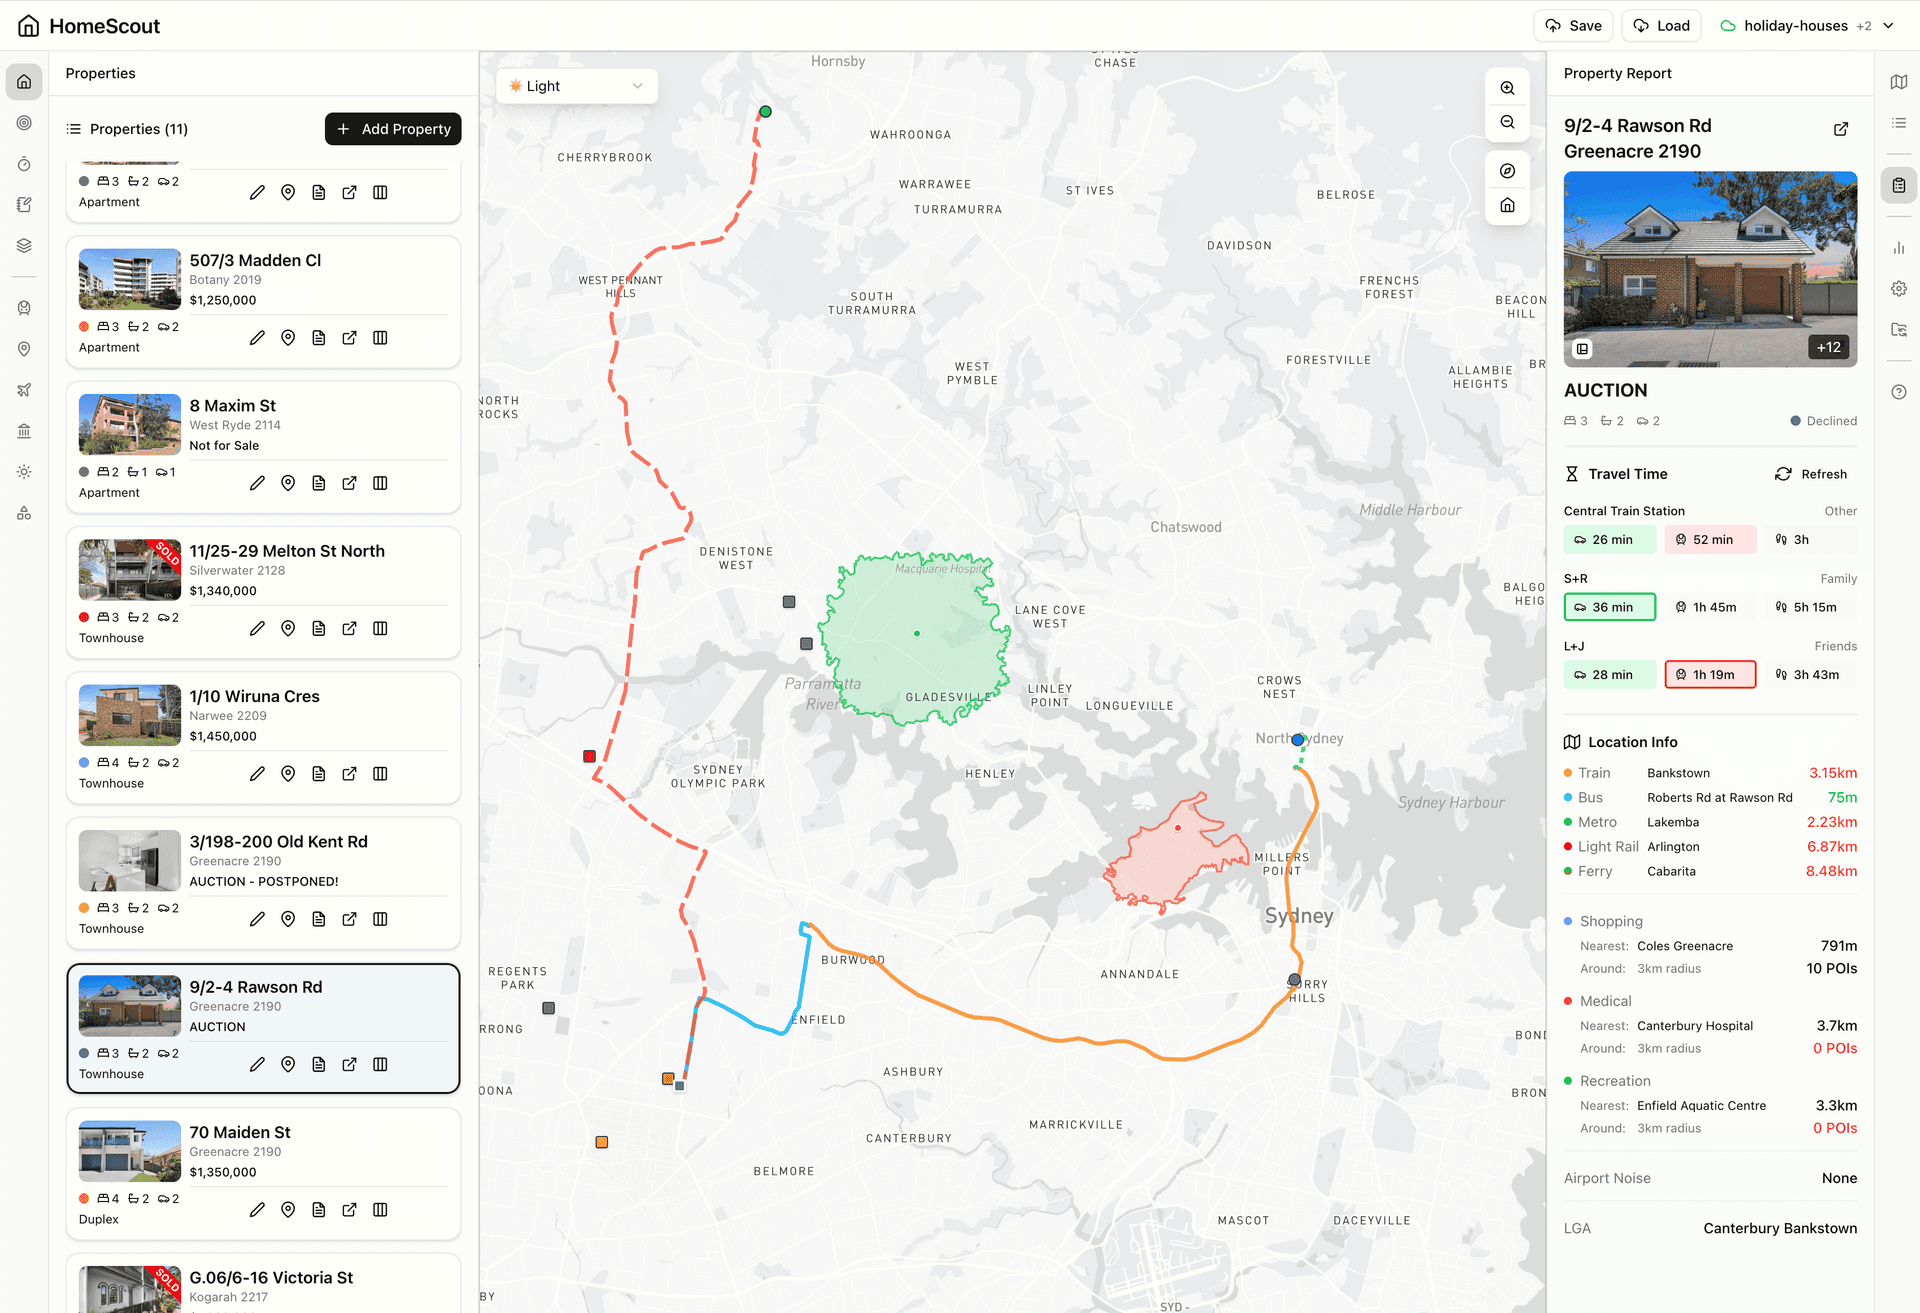
Top Bar
The collaboration toolbar is located here. Collab spaces can be created or joined to share data with others. Save and load operations for cloud sync are also accessible from this area.
Left Sidebar
Data management panels are found here. Properties, reference points, isochrones, notes, and map overlays can all be managed from the left sidebar. This is where most data input and manipulation occurs.
Map (Centre)
The interactive map displays all properties, reference points, isochrones, and enabled overlays. The map can be panned, zoomed, rotated, and right-clicked for additional actions.
Right Sidebar
Output and settings panels are located here. Map controls, the legend, property reports, settings, and import/export functionality can be accessed from the right sidebar.
Collaboration
myHomeScout supports sharing data between multiple users through collab spaces. No account is required – simply create or join a space with a name and password.
Connect to Space
When not connected to any collab space, this button is displayed. A new space can be created, or an existing space can be joined by entering the space name and password.
Space Indicator
When connected, the active space name is shown. Multiple spaces can be joined, and switching between them is done through the dropdown menu. Spaces can also be left from this menu.
Save
Uploads all local data (properties, reference points, notes, annotations) to the active collab space. This overwrites any existing data in the cloud.
Load
Downloads data from the active collab space. If local data exists, a choice is presented to either replace local data entirely or merge the two datasets together.
Left Sidebar Panels
Properties
The properties panel is where properties can be added, removed, and managed.
Properties are the core data of myHomeScout. Each property represents a listing that is being evaluated, with details such as address, price, bedrooms, and status.
Add Property
Opens a dialog to add a new property. Properties can be added by pasting a Domain.com.au URL (data is automatically extracted) or by entering details manually.
Property List
All saved properties are displayed in a list. Properties can be filtered by status or searched by address. Sorting options include date added, price, and status.
View on Map
Clicking the map icon next to a property centres the map on that property's location.
View Report
Clicking a property opens the detailed property report in the right sidebar.
Edit
Property details such as status, tags, and notes can be modified.
Delete
Removes the property from the list. This action cannot be undone.
Reference Points
The reference points panel is where important locations can be saved for travel time calculations.
Reference points represent locations that matter – such as workplaces, family homes, or friends' addresses. Travel times from properties to these points can be calculated and compared.
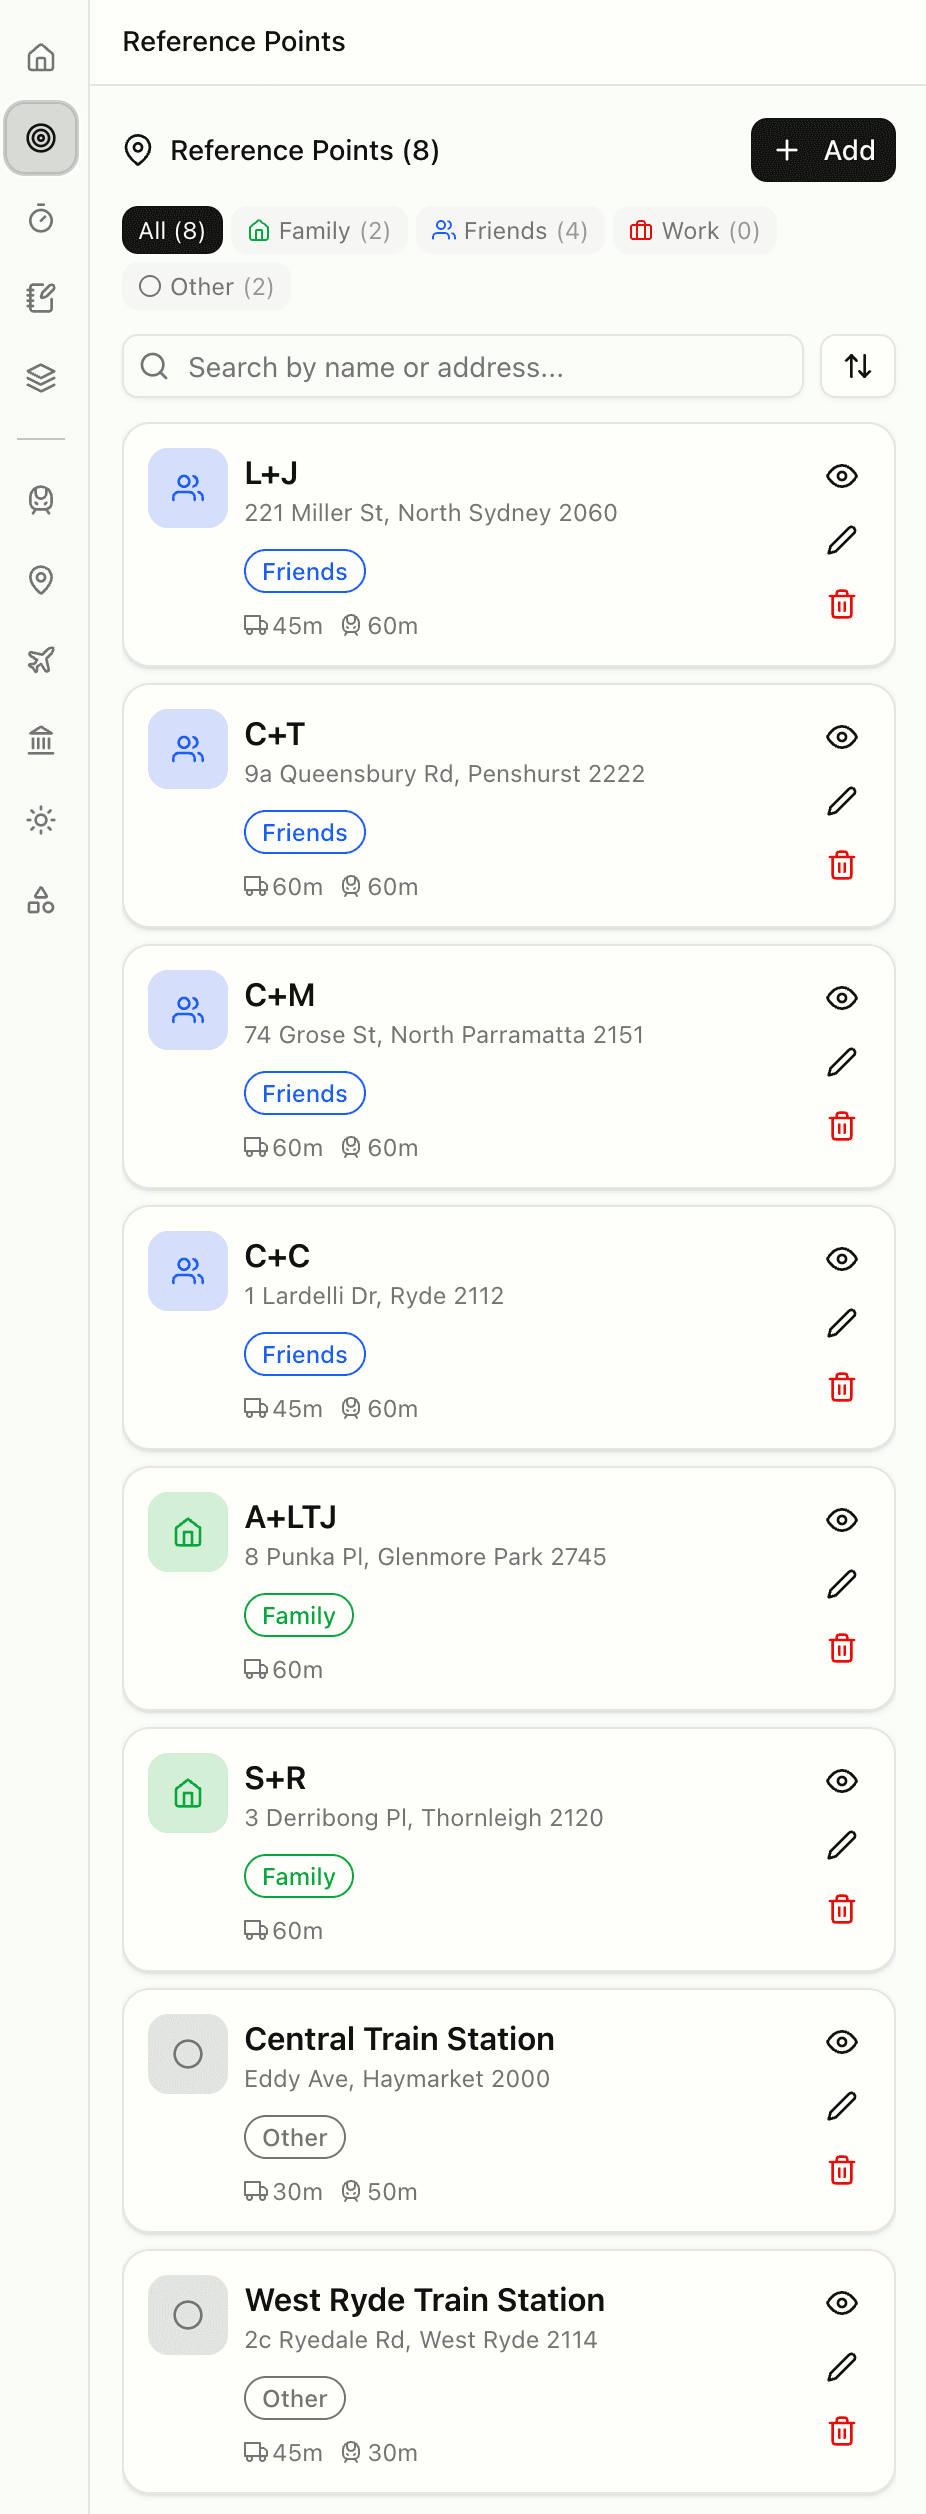
Add
Opens a dialog to add a new reference point. A name and address are entered, the address is geocoded automatically, and a category is selected.
Category Filter
Reference points can be filtered by category using the filter buttons: All, Family, Friends, Work, or Other. The count of points in each category is displayed.
Categories
Reference points are colour-coded by category: green for Family, blue for Friends, orange for Work, and grey for Other.
Toggle Visibility
The eye icon toggles whether a reference point is shown on the map and included in travel time calculations.
Edit
Opens the edit dialog to modify the reference point's name, address, category, or travel time requirements.
Delete
Removes the reference point. This action cannot be undone.
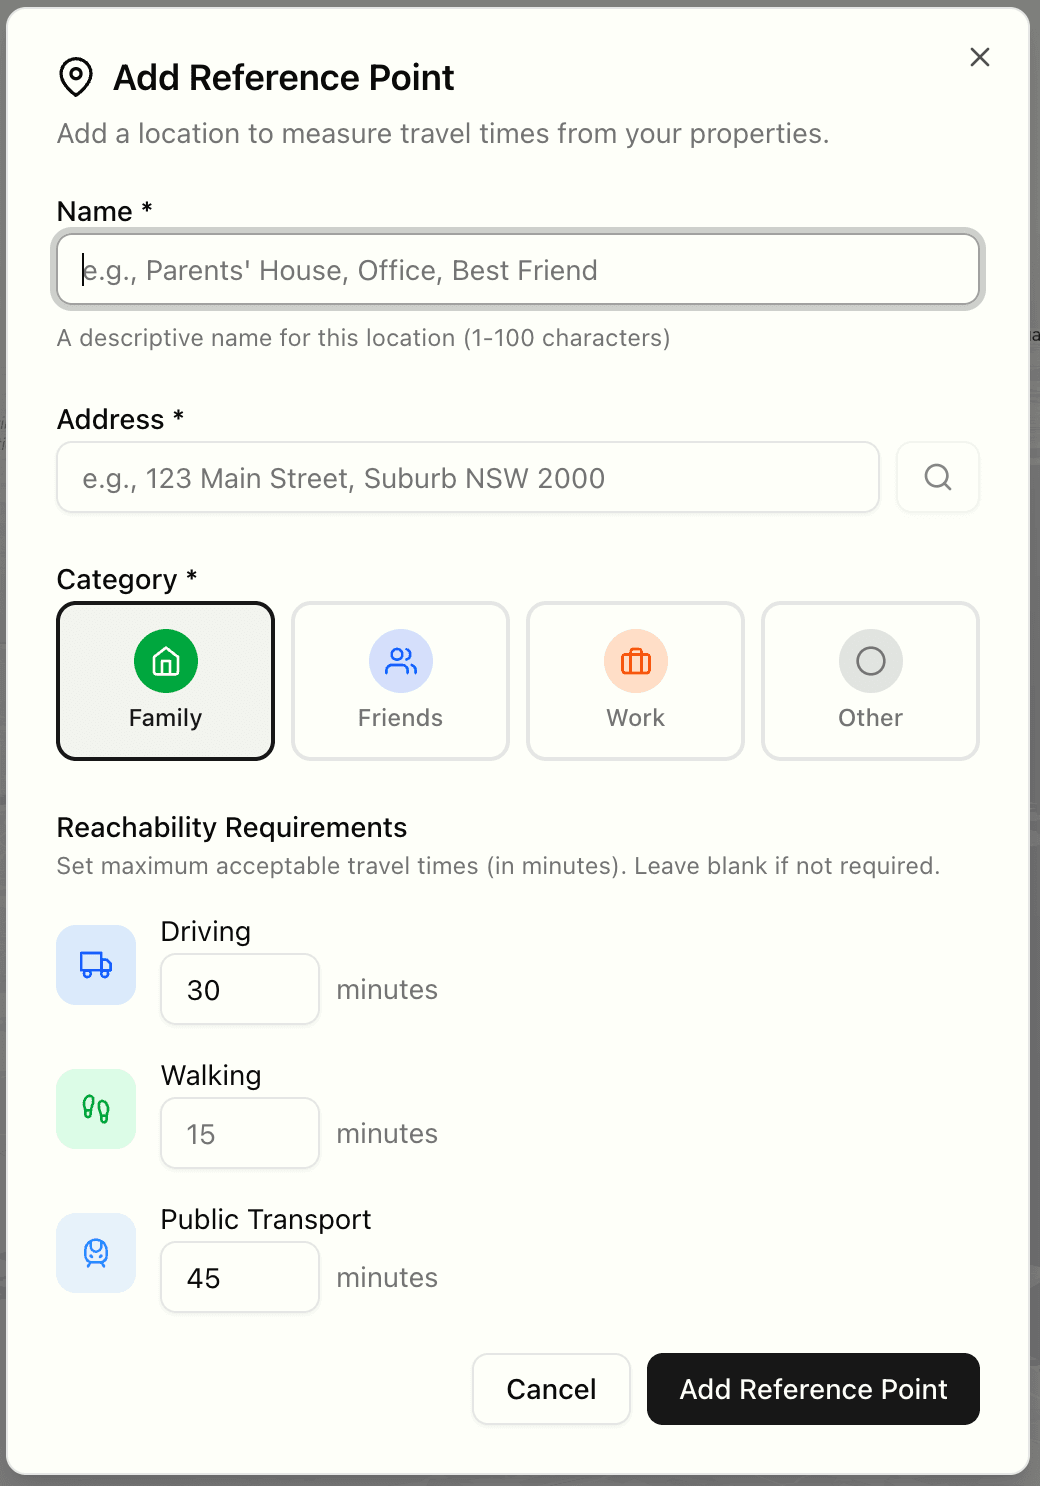
Reachability Requirements
Maximum acceptable travel times can be set per reference point for driving, walking, and public transport. These are displayed as green (within requirement) or red (exceeds requirement) indicators in property reports.
Isochrones
The isochrones panel is where travel time boundaries can be generated and managed.
Isochrones are areas on the map showing how far can be travelled within a certain time from a given point. They help visualise commute zones and accessibility.
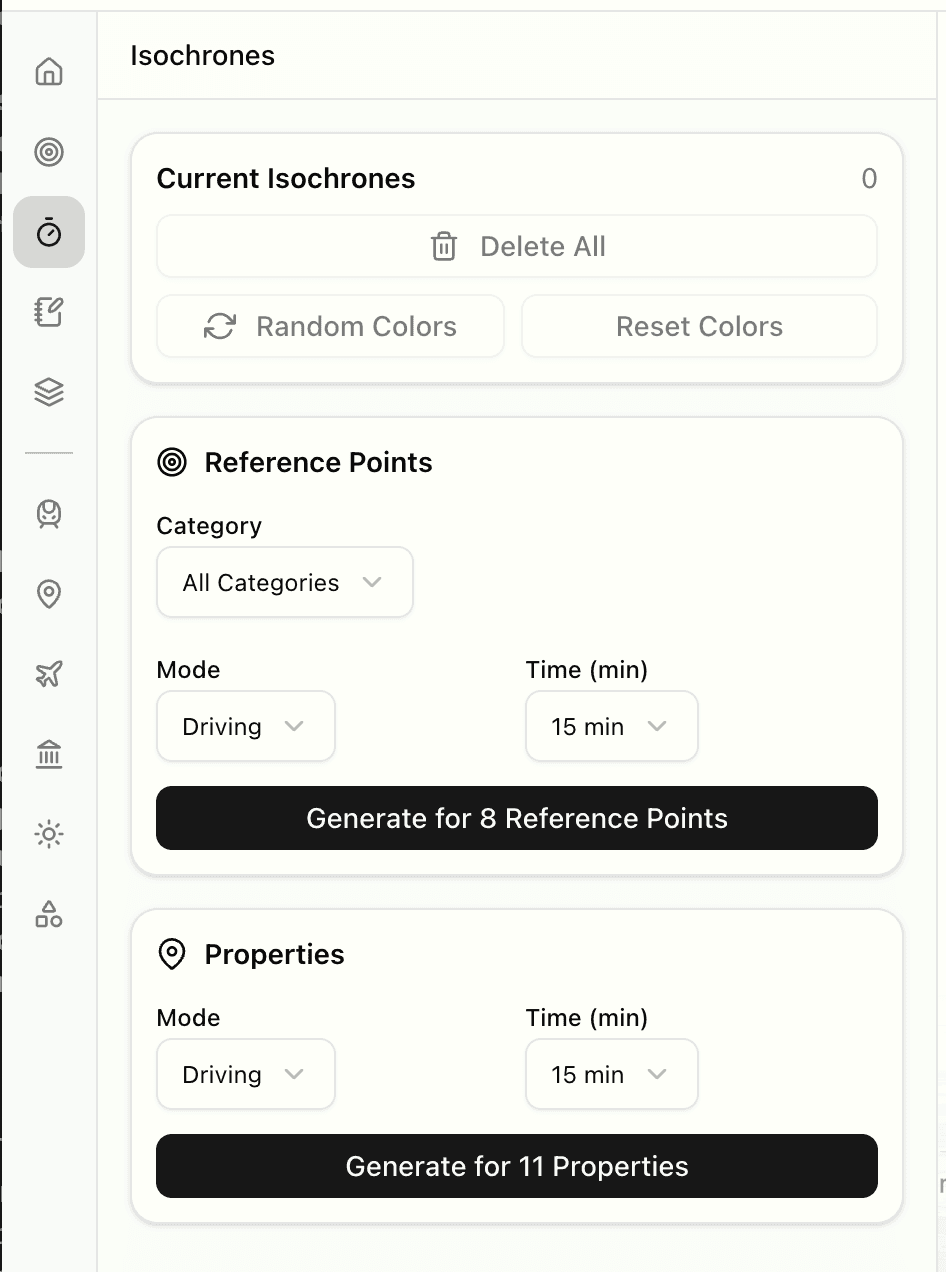
Current Isochrones
Displays the number of isochrones currently shown on the map.
Delete All
Removes all isochrones from the map.
Random Colors / Reset Colors
Assigns new random colours to all existing isochrones, or resets them to their default transport mode colours.
Reference Points Section
Category Filter
A dropdown to filter which reference point categories to generate isochrones for (All Categories, Family, Friends, Work, Other).
Mode
A dropdown to select the transport mode: Driving, Walking, or Transit.
Time (min)
A dropdown to select the travel time: 5, 15, 30, or 60 minutes.
Generate for Reference Points
Creates isochrones for all active reference points matching the selected category filter.
Properties Section
Generate for Properties
Creates isochrones for all saved properties using the selected mode and time settings.
Notes
The notes panel provides a rich text editor for keeping research notes and observations.
Notes are saved automatically and support markdown formatting. They are useful for recording thoughts, comparisons, or any information related to the property search.
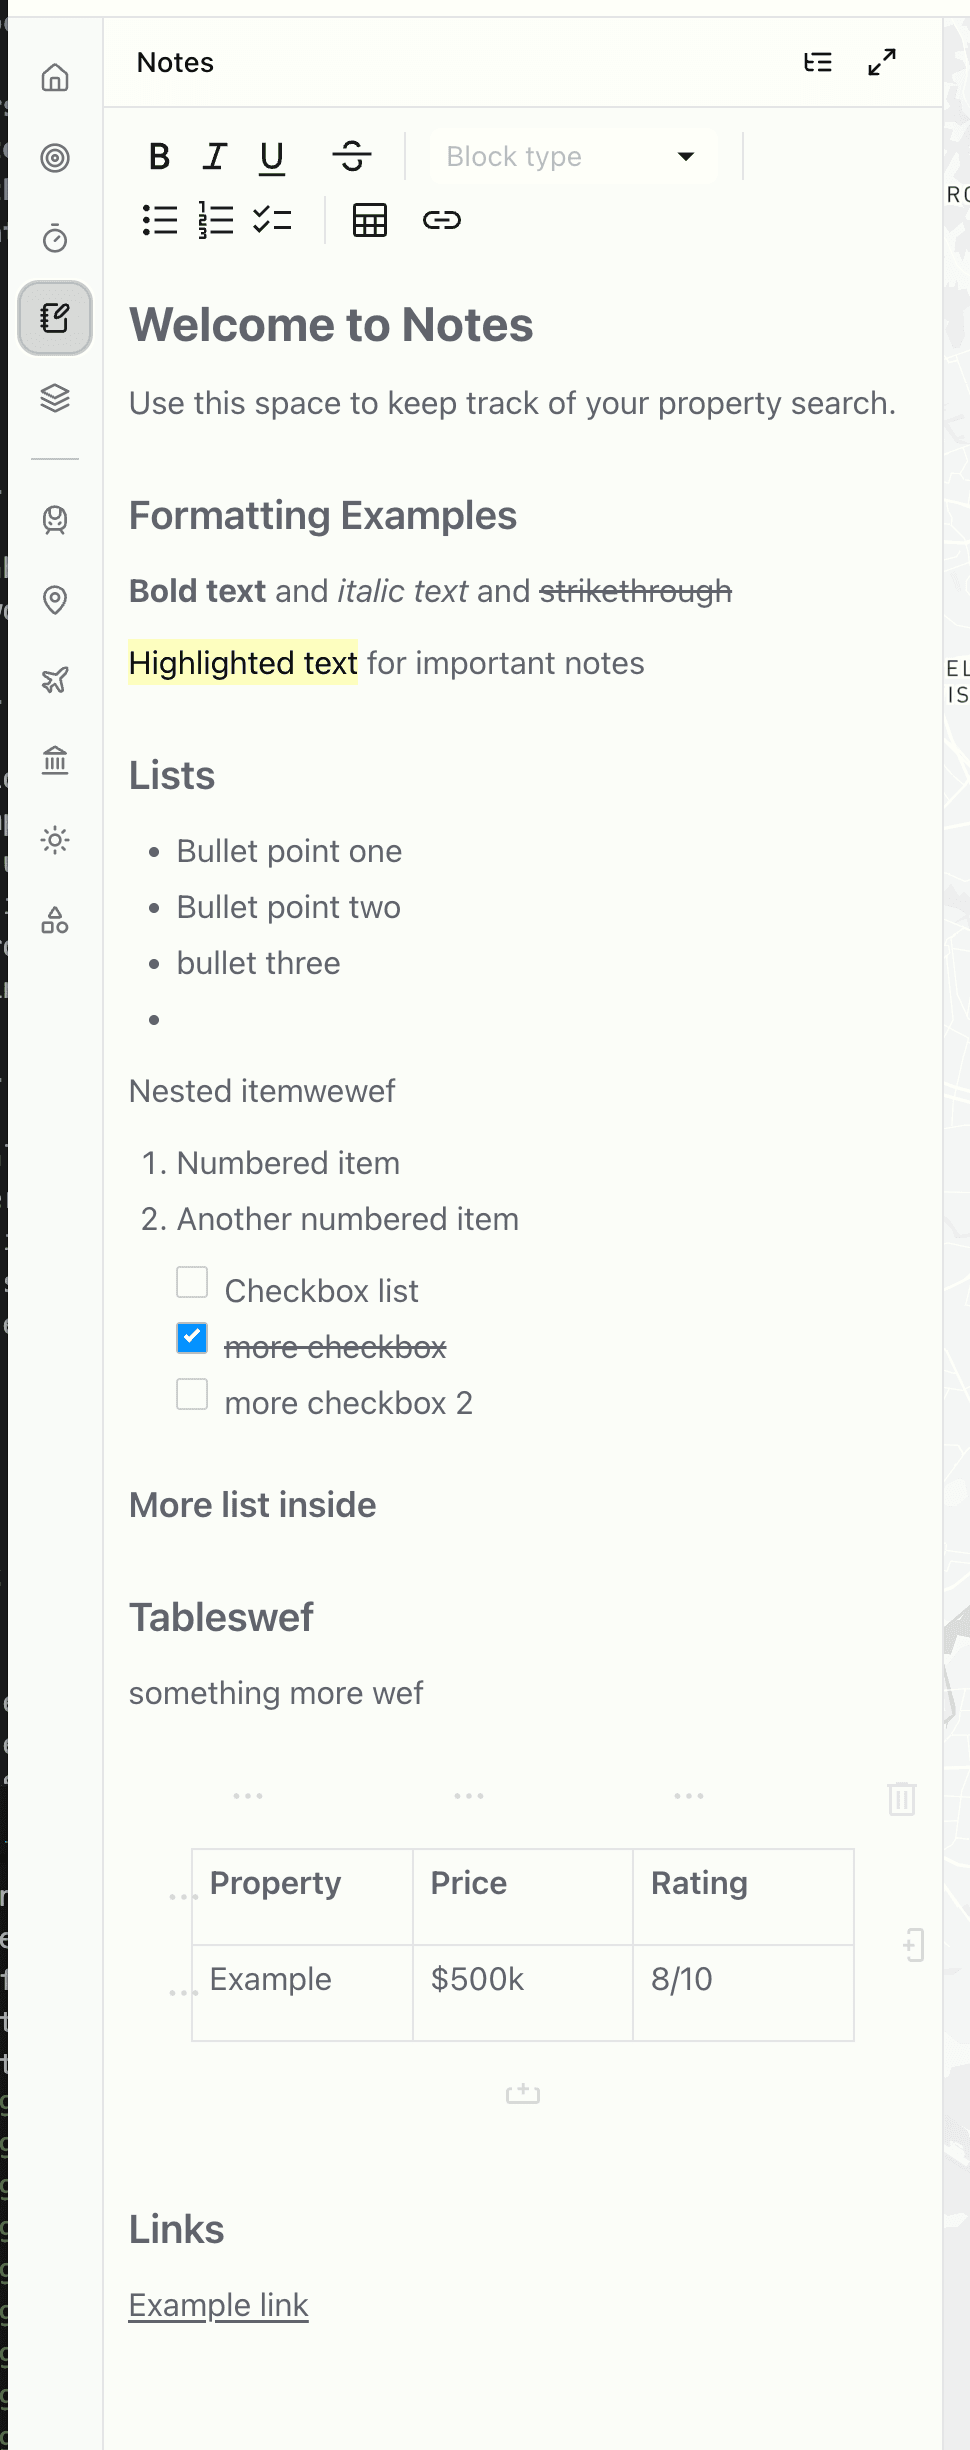
Text Formatting
The toolbar provides Bold, Italic, Underline, and Strikethrough formatting. Block types (headings, quotes), bullet lists, numbered lists, checklists, tables, and links can also be added.
Expand Panel
The expand button in the header expands the notes panel to 50% of the screen width for a larger editing area. Click again to return to normal width.
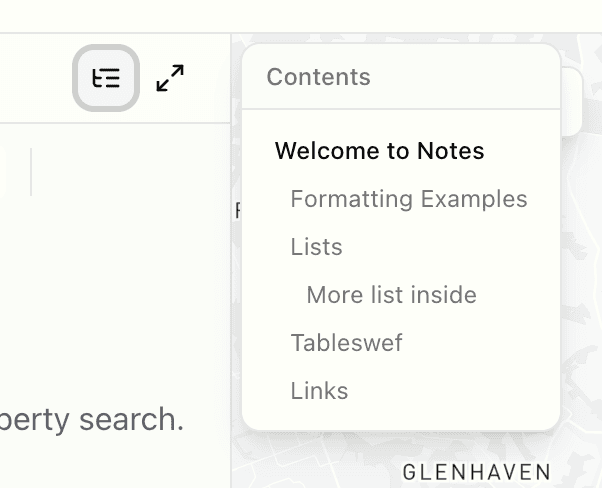
Table of Contents
The list button opens a table of contents overlay showing all headings in the notes. Clicking a heading scrolls the editor to that section.
Auto-Save
Changes are saved automatically after a brief pause in typing. A 'Saved' indicator appears briefly in the header to confirm.
Overlays
The overlays panel controls additional data layers that can be displayed on the map.
Various overlays provide contextual information about areas – such as public transport access, airport noise levels, and points of interest. Each overlay can be toggled on or off using the switch.
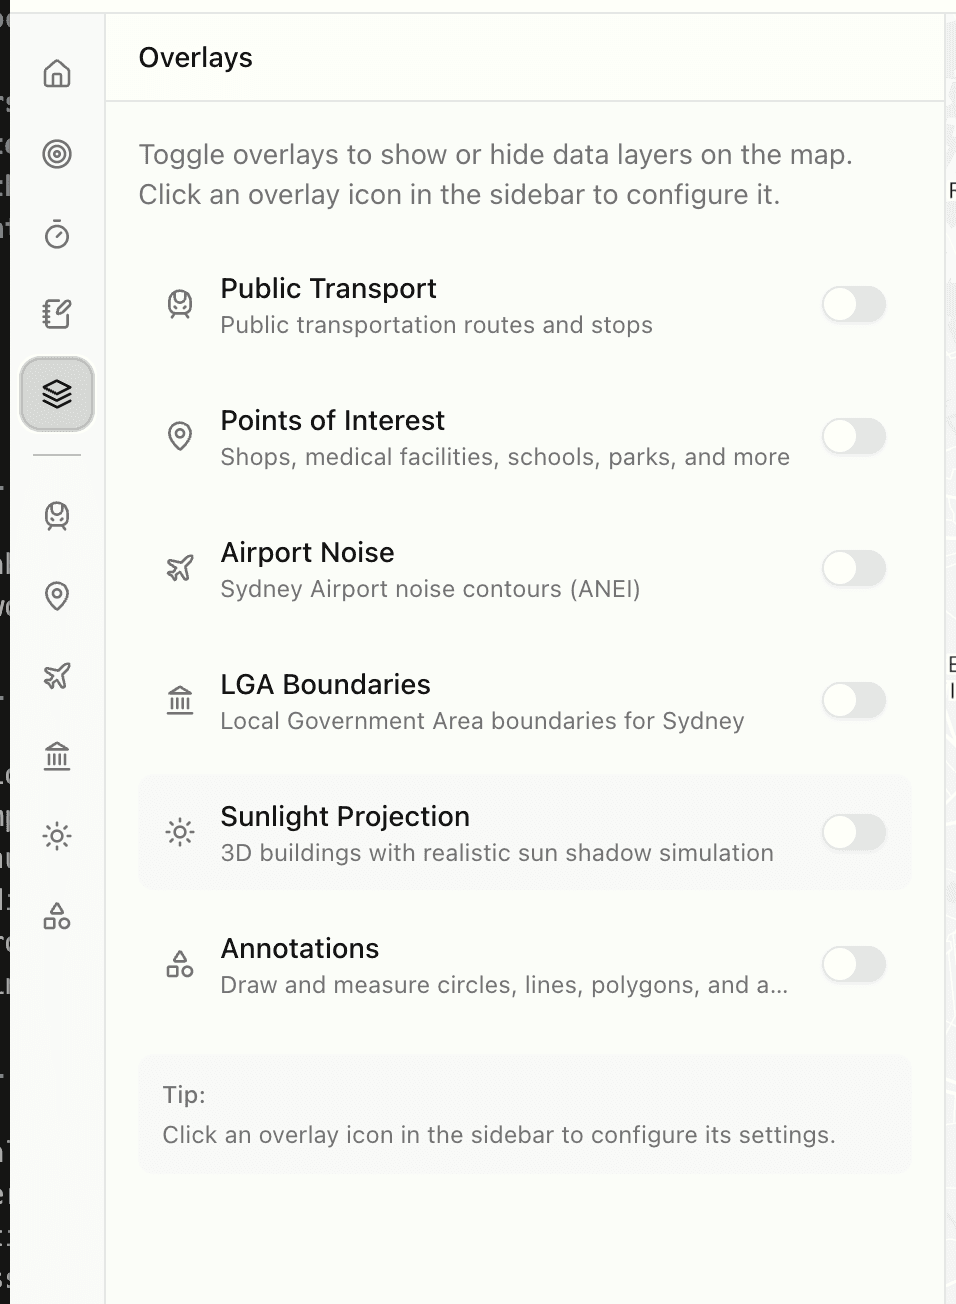
When an overlay is enabled, its icon appears in the left sidebar below the main panels. Clicking the icon opens the configuration panel for that overlay.
Public Transport
Displays public transport routes and stops on the map.
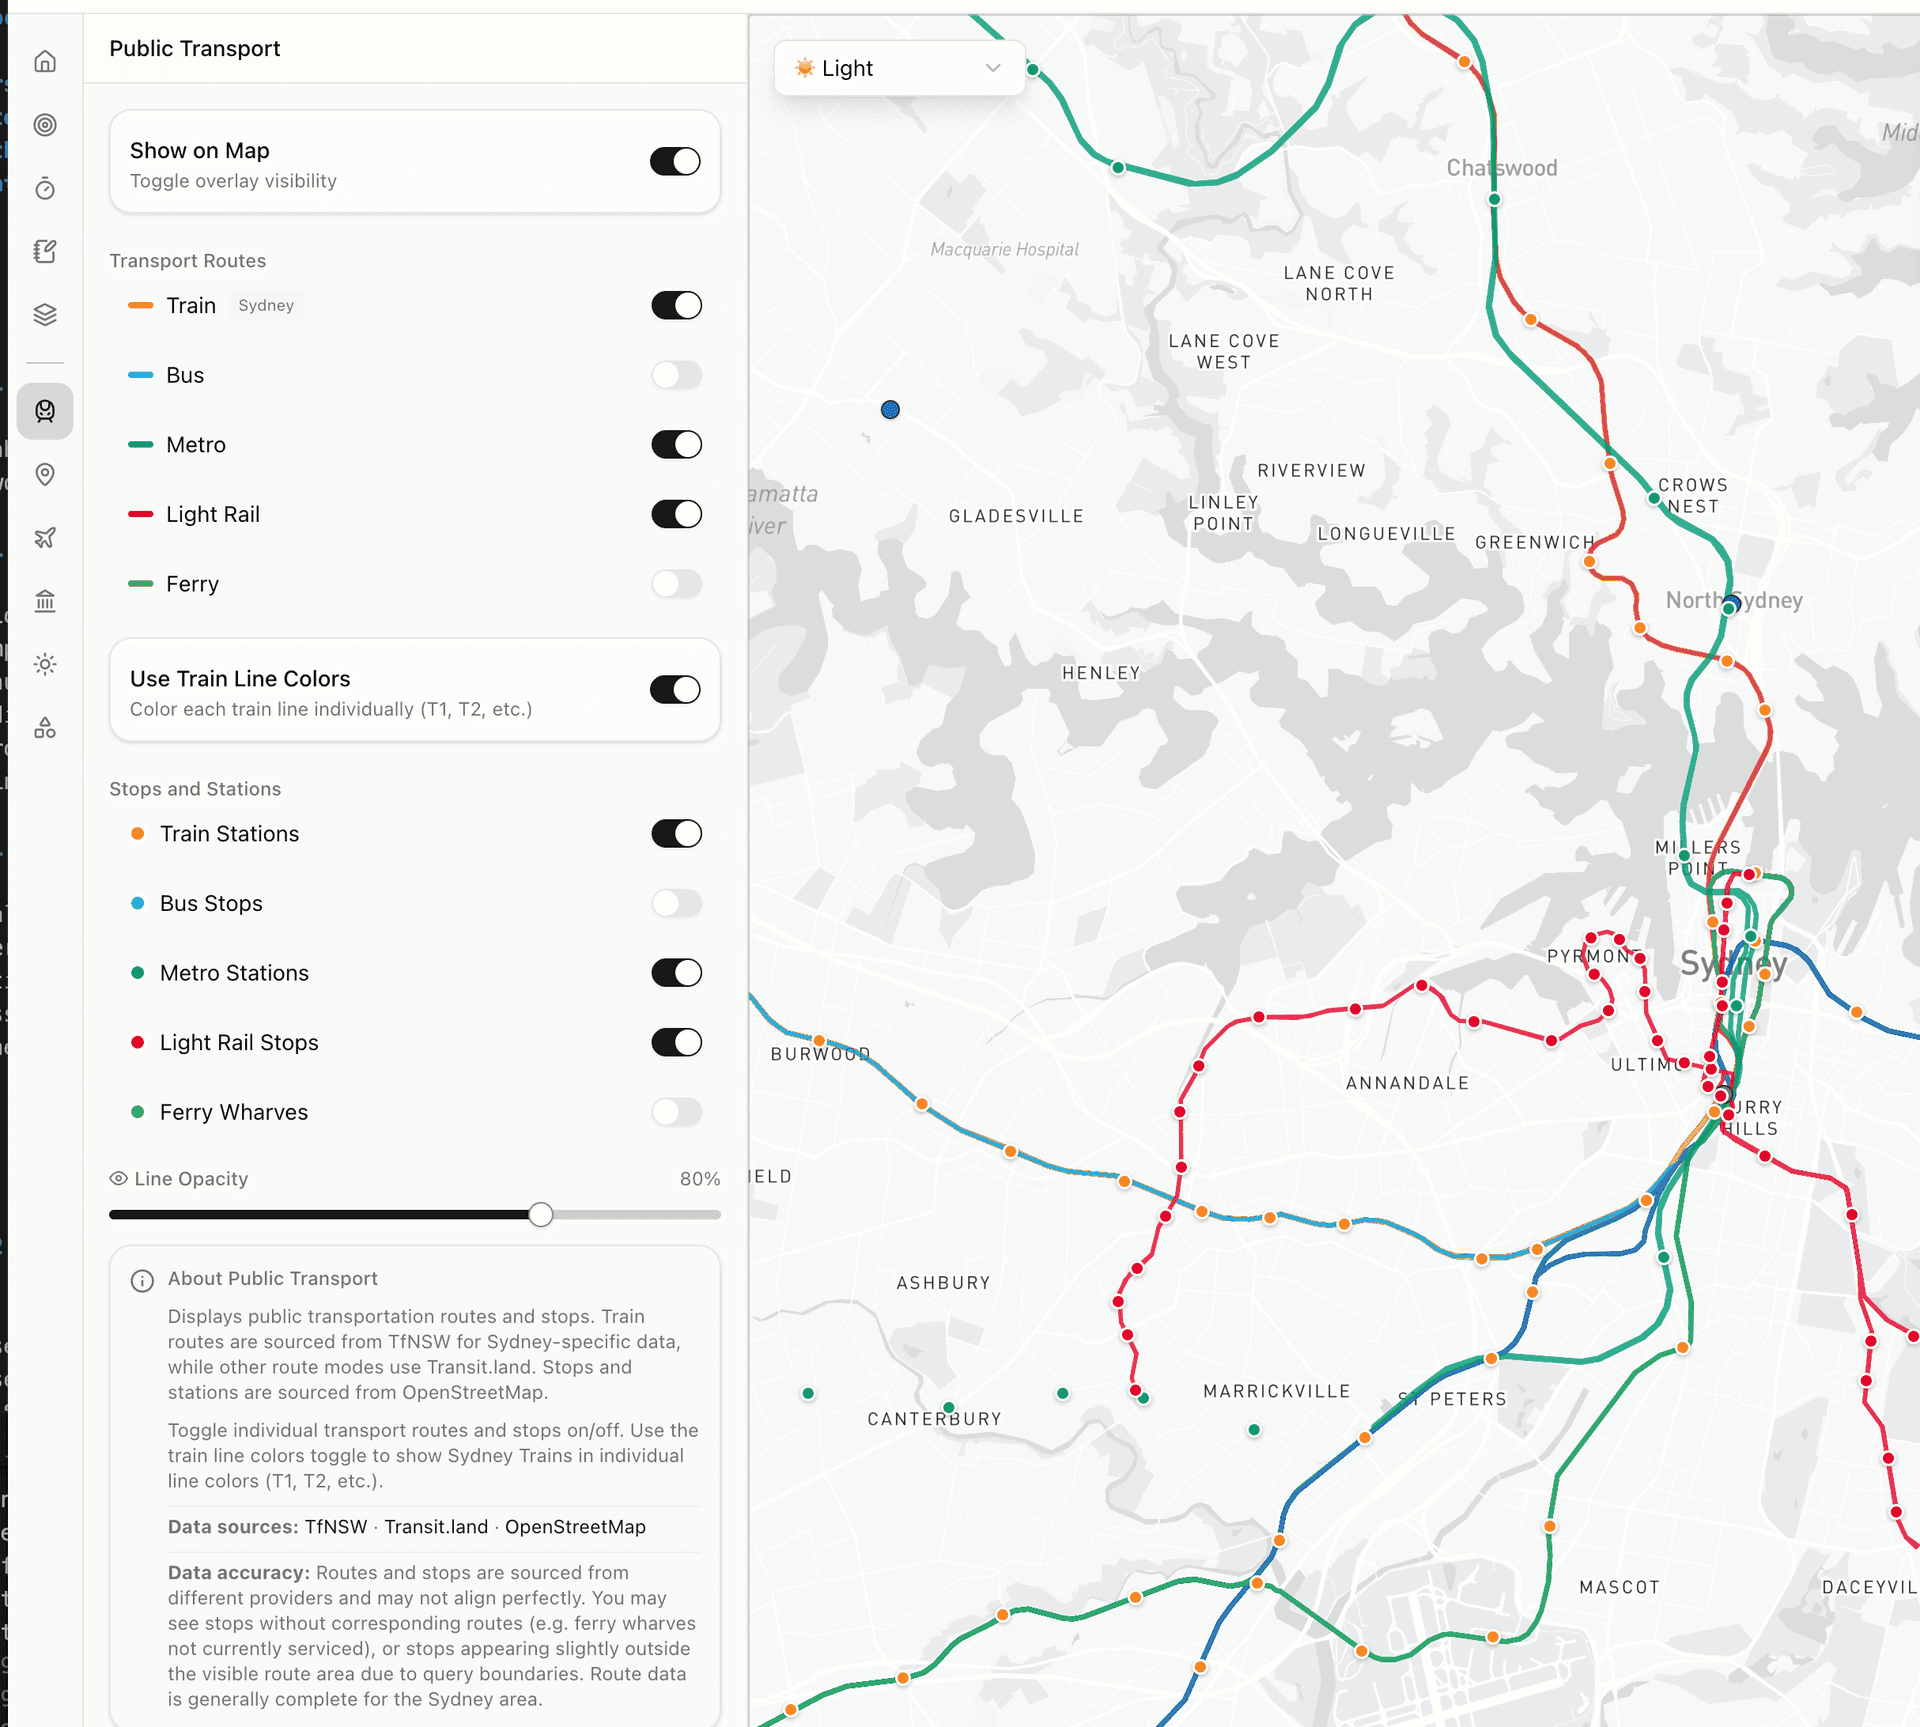
Transport Routes
Individual transport types can be toggled: Train, Bus, Metro, Light Rail, and Ferry. Each type has a distinct colour.
Use Train Line Colors
When enabled, individual train lines (T1, T2, etc.) are shown in their official TfNSW colours.
Stops and Stations
Station and stop markers can be toggled independently for each transport type.
Line Opacity
A slider to adjust the transparency of route lines.
Points of Interest
Shows nearby amenities such as shops, medical facilities, schools, parks, and dining options.
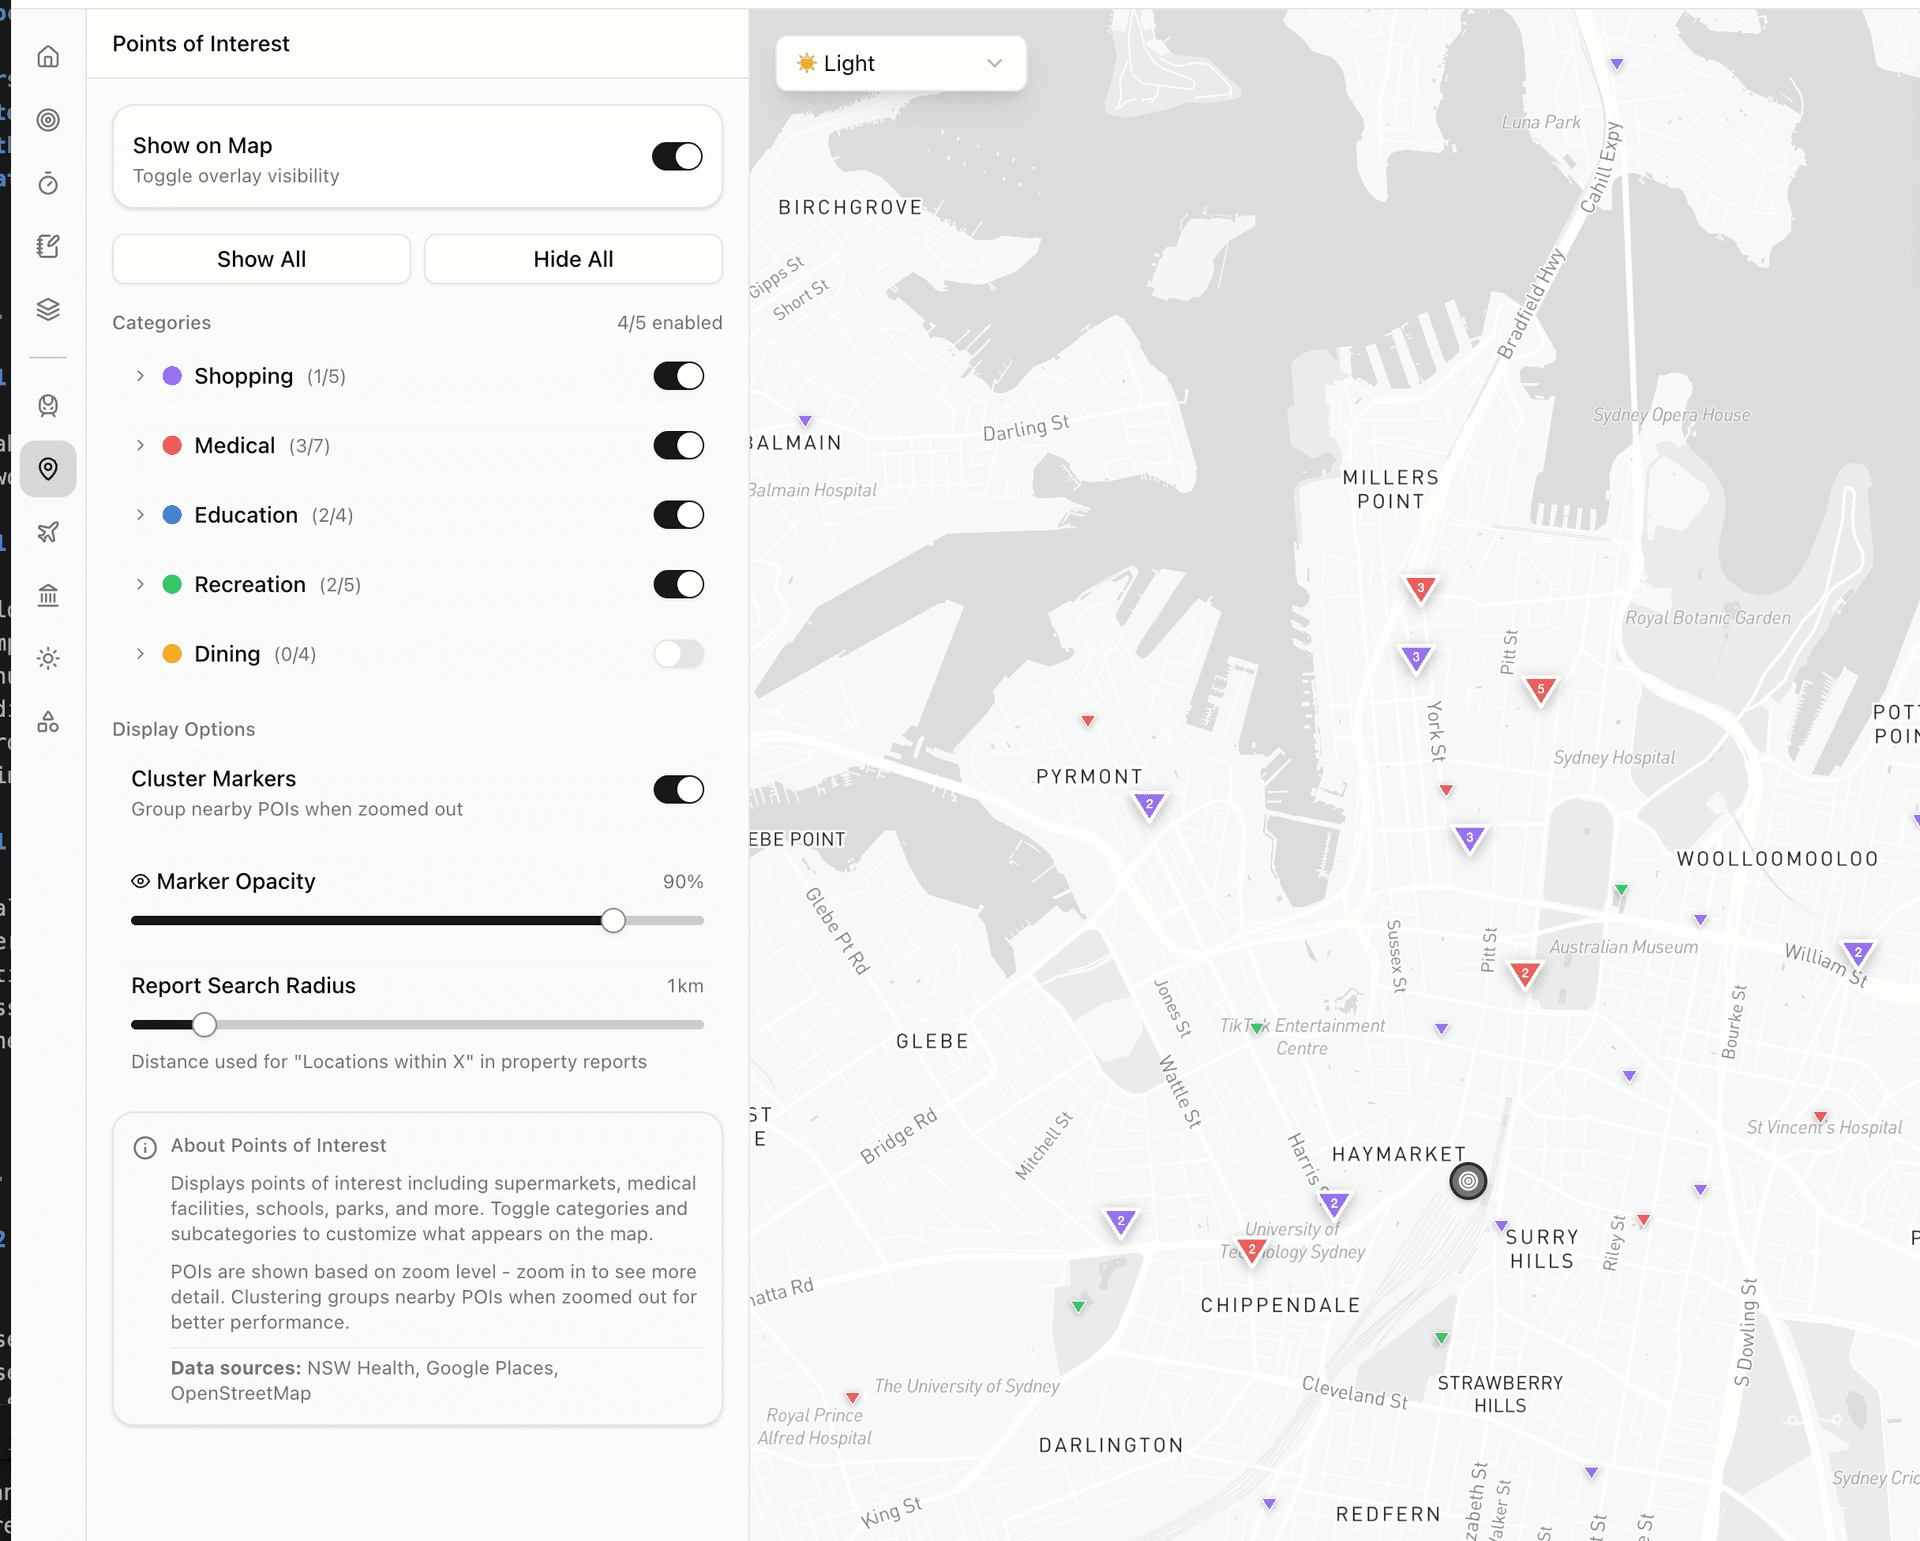
Show All / Hide All
Quickly enable or disable all POI categories at once.
Category Toggles
Individual categories can be toggled: Shopping, Medical, Education, Recreation, and Dining. The count of POIs in each category is shown.
Cluster Markers
When enabled, nearby POIs are grouped together when zoomed out for better performance and clarity.
Report Search Radius
Sets the distance used for 'Locations within X' counts in property reports.
Airport Noise
Displays aircraft noise contours from Sydney Airport based on ANEI (Australian Noise Exposure Index) data.
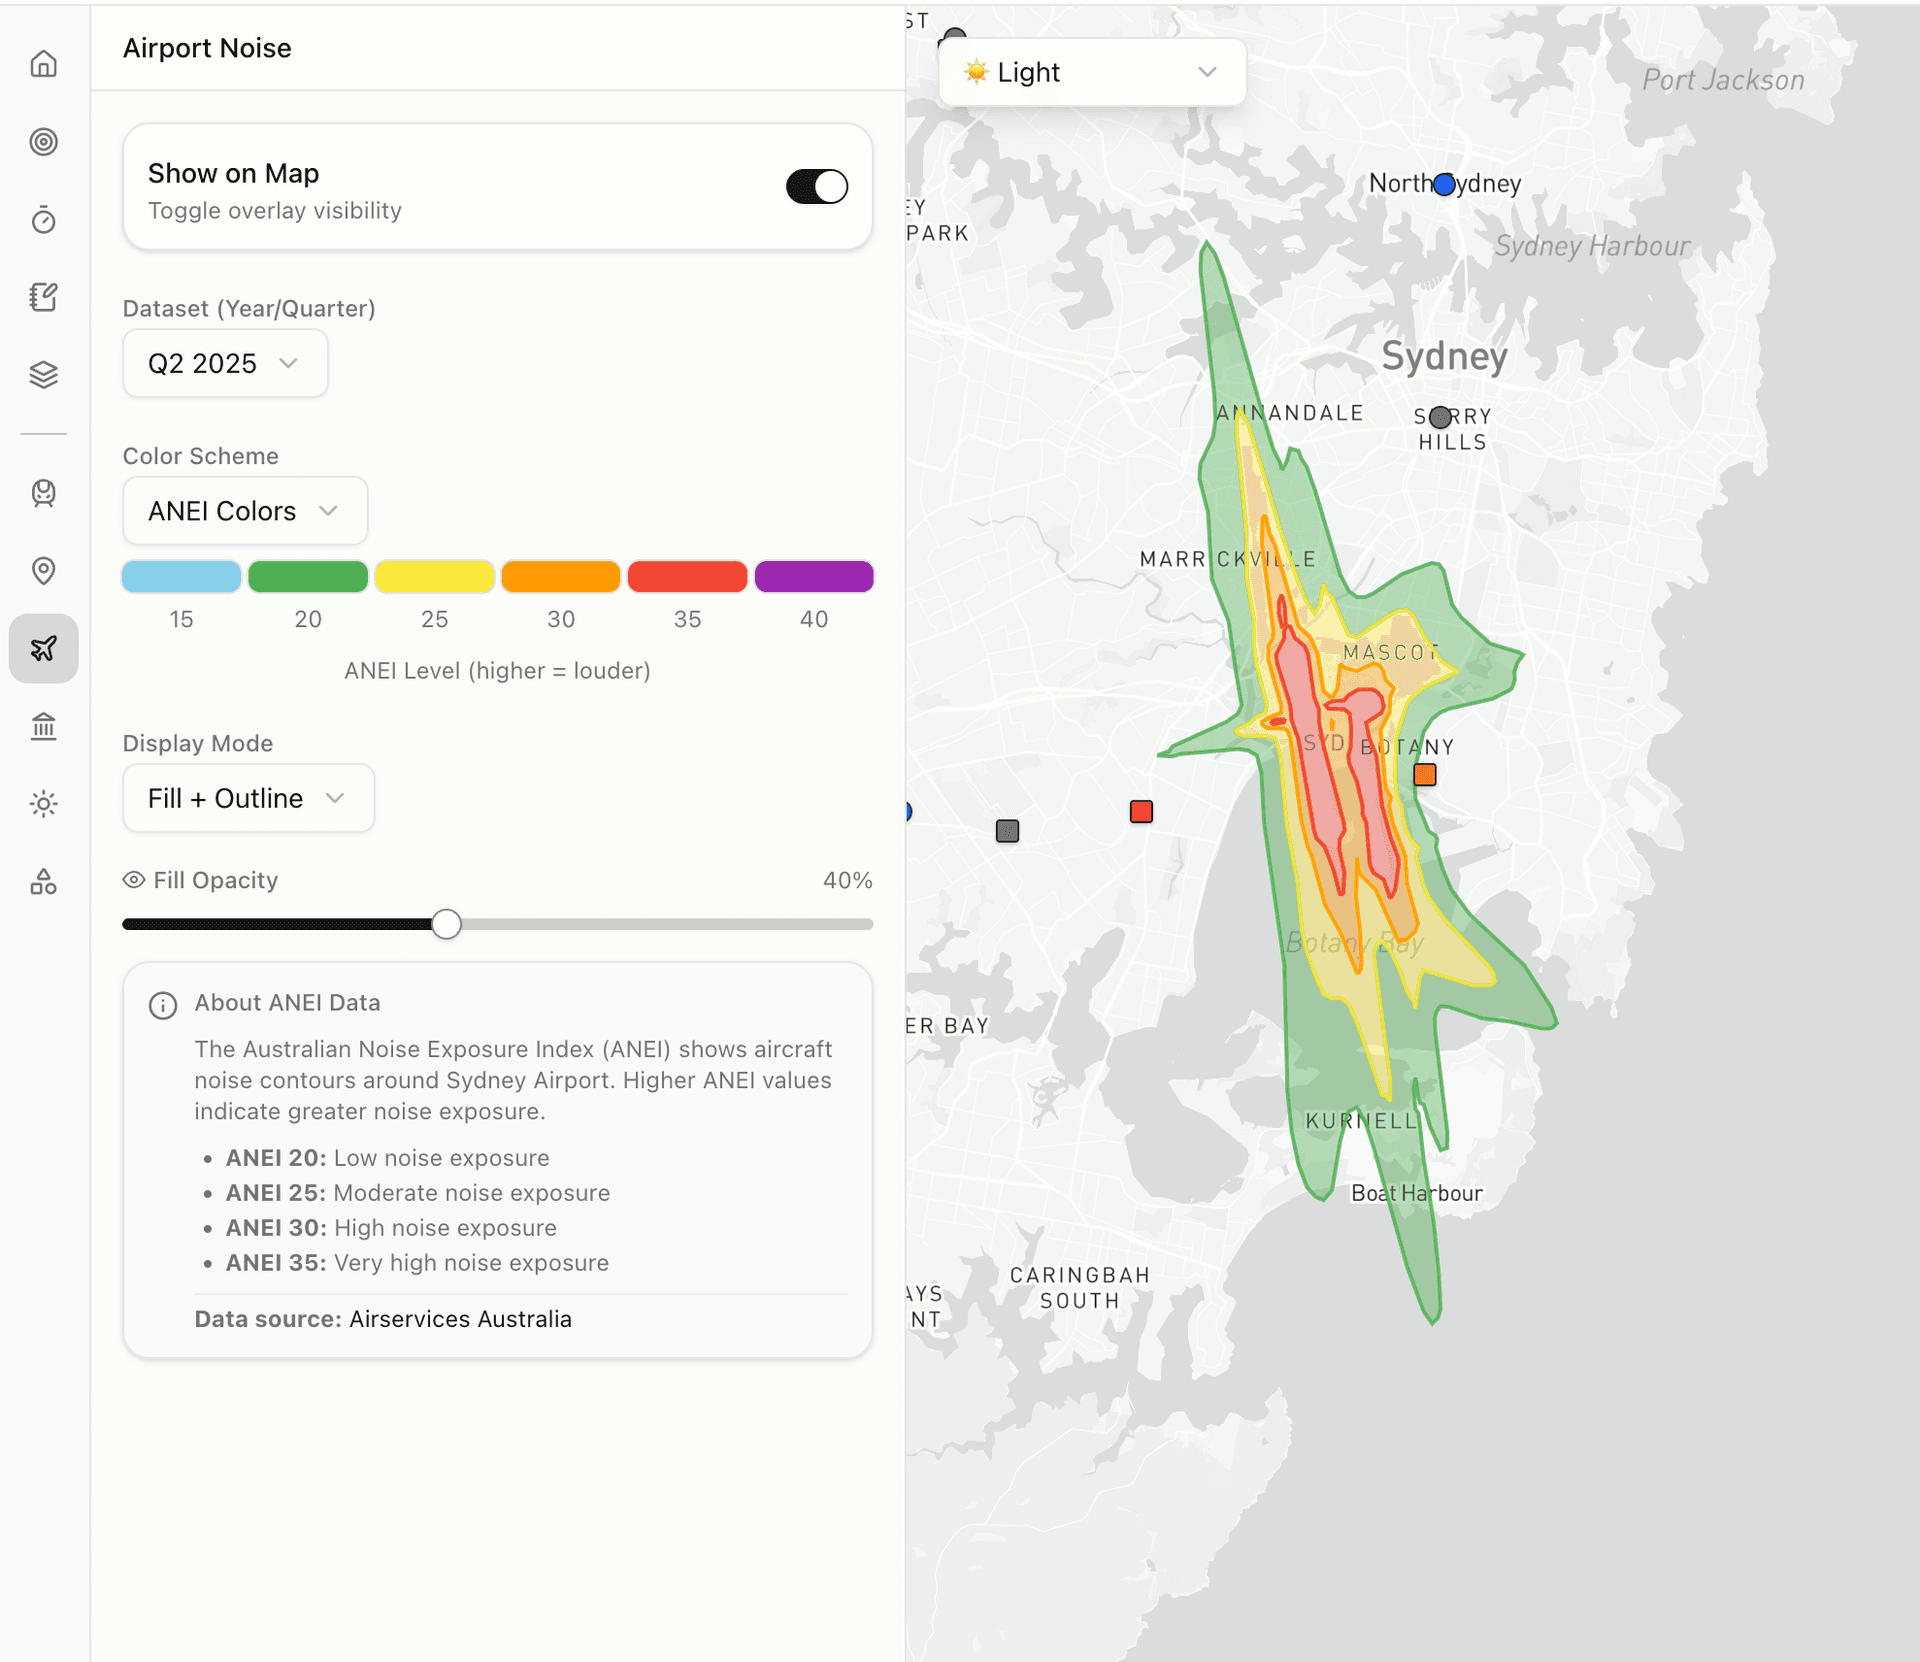
Dataset (Year/Quarter)
Select which quarterly noise dataset to display.
Color Scheme
Choose between ANEI Colors (official) or other colour schemes.
Display Mode
Choose how contours are rendered: Fill + Outline, Fill Only, or Outline Only.
ANEI Levels
The legend explains noise levels: ANEI 20 (low exposure) through ANEI 35+ (very high exposure).
LGA Boundaries
Shows Local Government Area boundaries for Sydney councils.
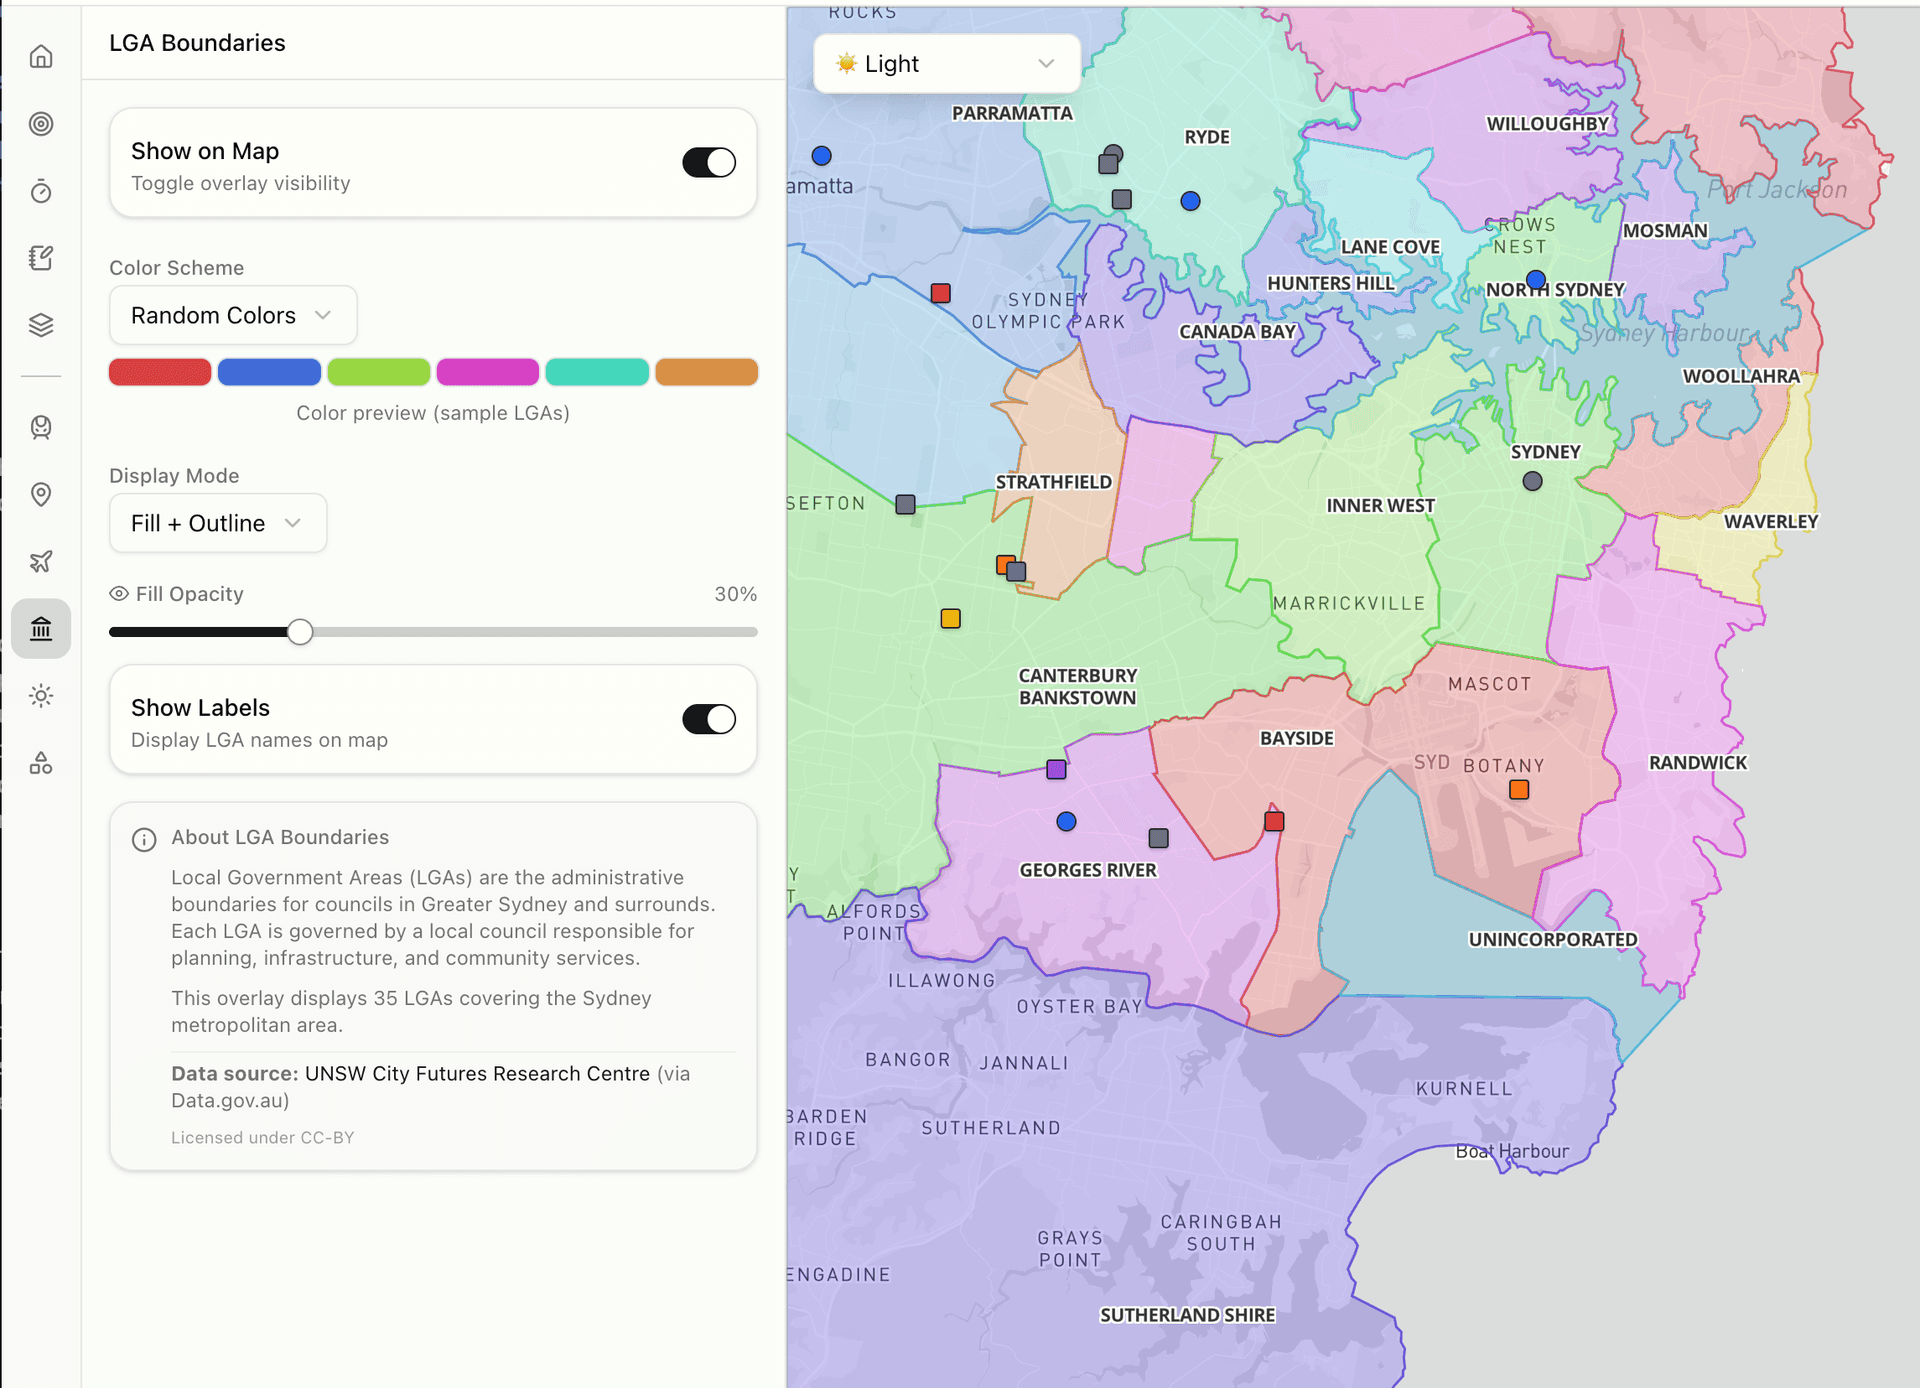
Color Scheme
Choose between Random Colors or a single colour for all boundaries.
Display Mode
Choose how boundaries are rendered: Fill + Outline, Fill Only, or Outline Only.
Show Labels
Toggle to display LGA names on the map.
Sunlight Projection
Visualises 3D buildings with realistic sun shadow simulation for any date and time.
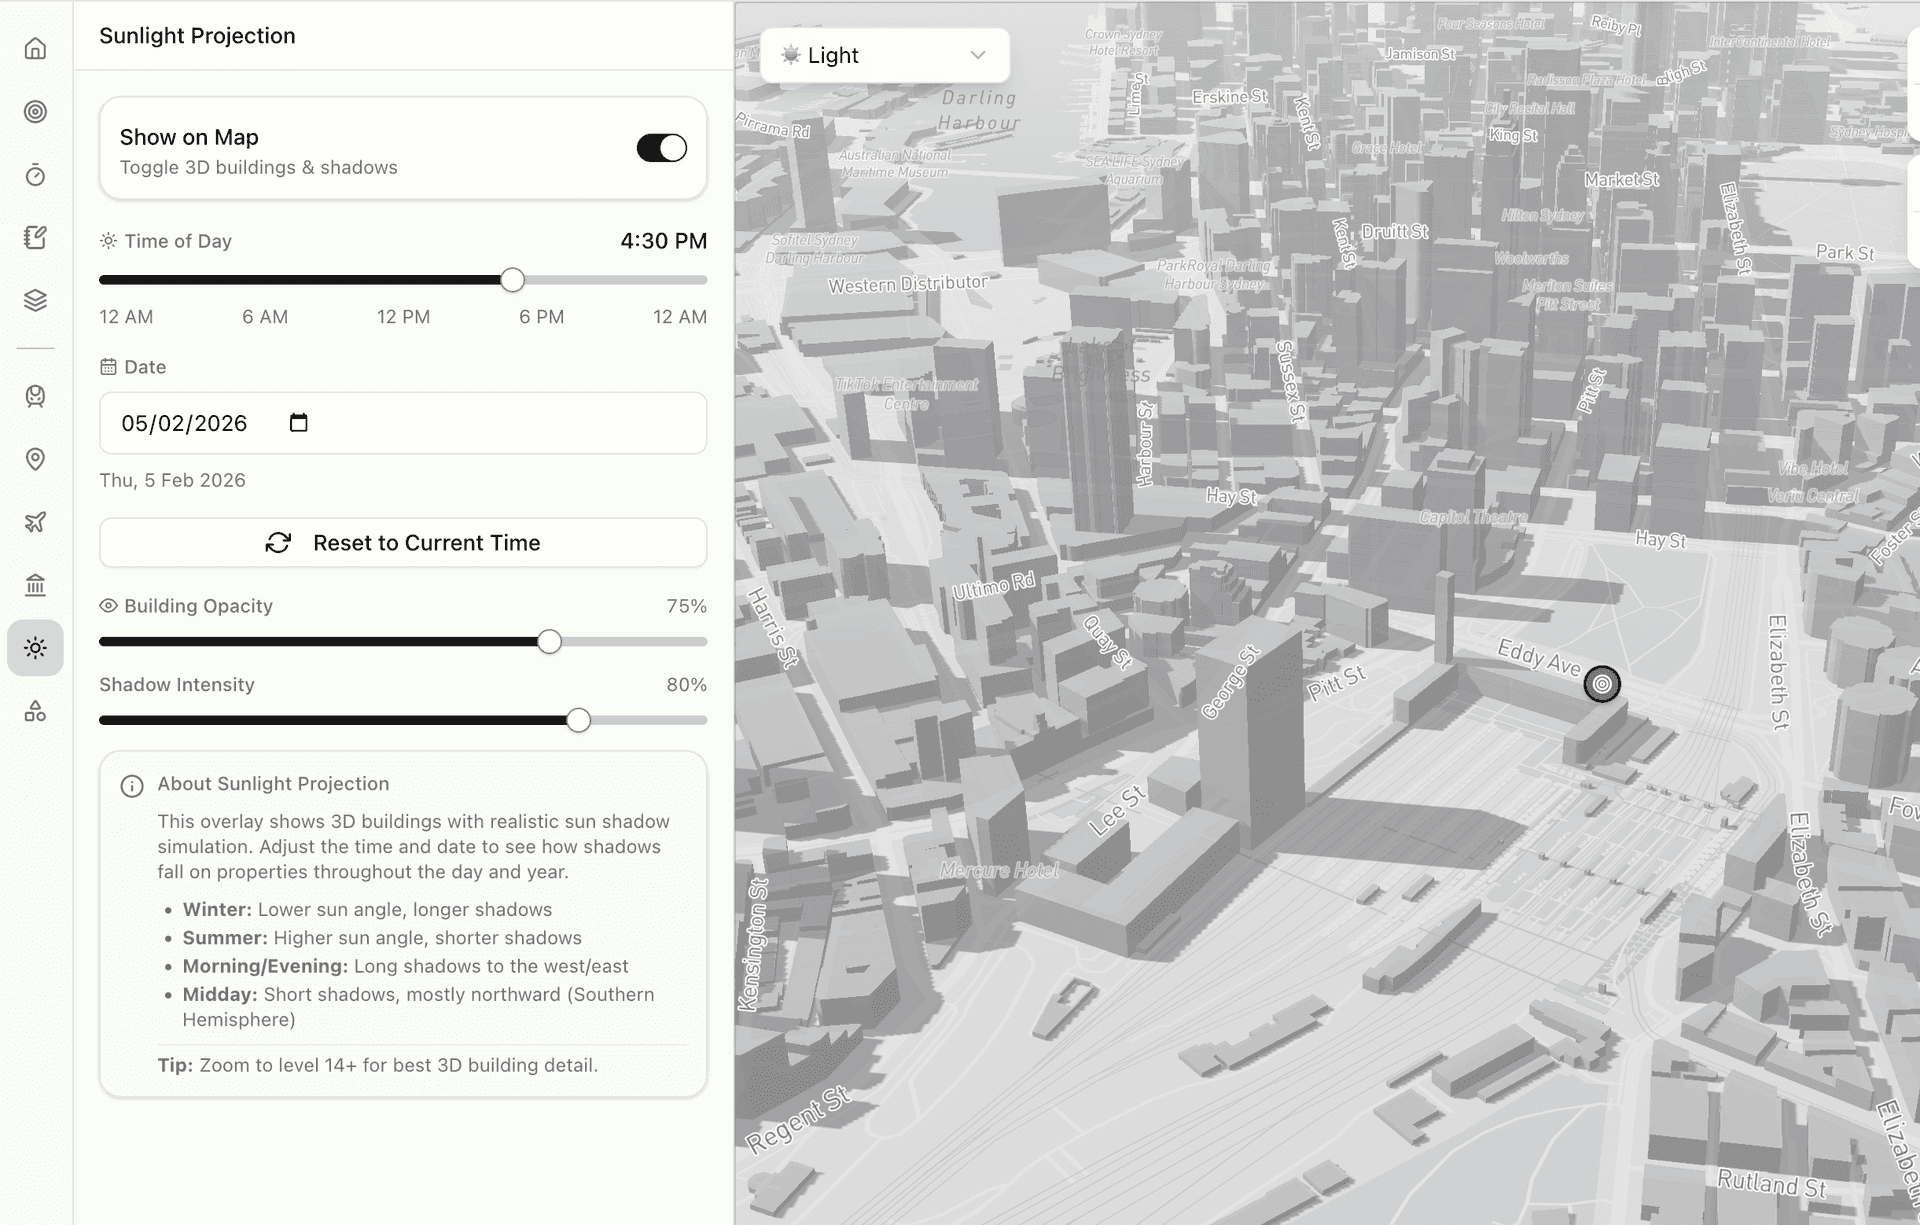
Time of Day
A slider to adjust the time from 12 AM to 12 AM (24 hours). The current time is displayed.
Date
A date picker to select any date for shadow calculation. Different seasons produce different shadow lengths.
Reset to Current Time
Resets both time and date to the current moment.
Building & Shadow Opacity
Sliders to adjust the transparency of 3D buildings and their shadows.
Annotations
Allows drawing custom shapes, lines, labels, and notes on the map.
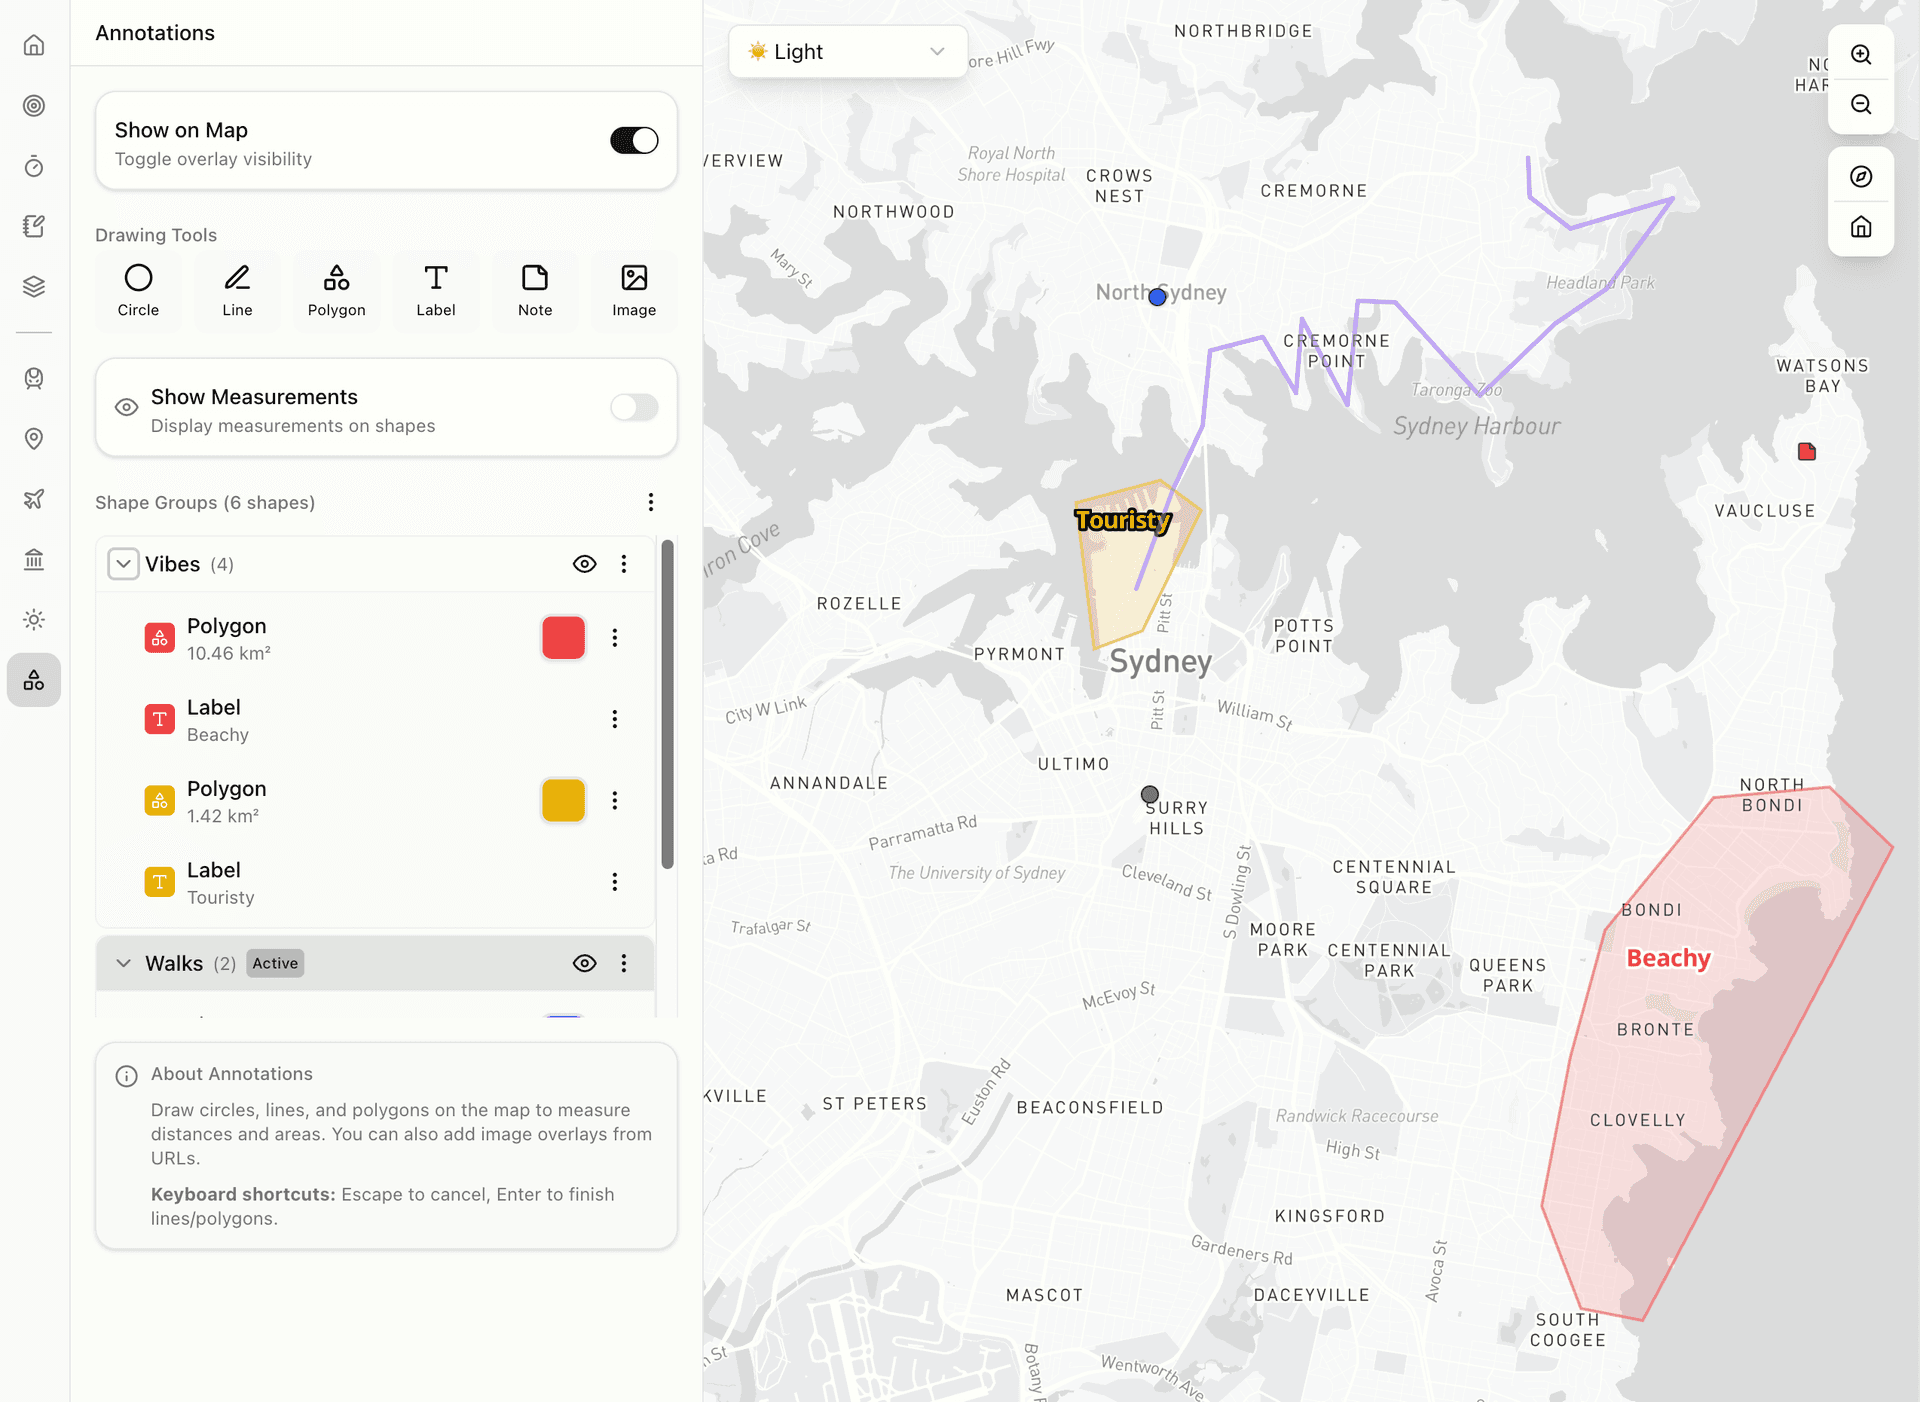
Drawing Tools
Circle, Line, Polygon, Label, Note, and Image tools are available. Select a tool and click/drag on the map to draw.
Show Measurements
When enabled, areas (km²) and distances are displayed on shapes.
Shape Groups
Annotations are organised into groups. Groups can be expanded/collapsed and toggled visible/hidden. Individual shapes can be selected for editing.
Map Interactions
The map uses Mapbox and supports standard map interactions along with myHomeScout-specific features.
Navigation
Pan
Click and drag to move around the map.
Zoom
Use the scroll wheel to zoom in and out. Double-click to zoom in on a specific point.
Rotate
Right-click and drag to rotate the map view. The bearing is shown in the Map Controls panel.
Tilt
Hold Ctrl and drag to tilt the map for a 3D perspective.
Reset View
The default map view can be configured in Settings. Use 'Use Current' to save the current view as the default starting position.
Context Menu (Right-Click)
Right-clicking anywhere on the map opens a context menu with the following options:
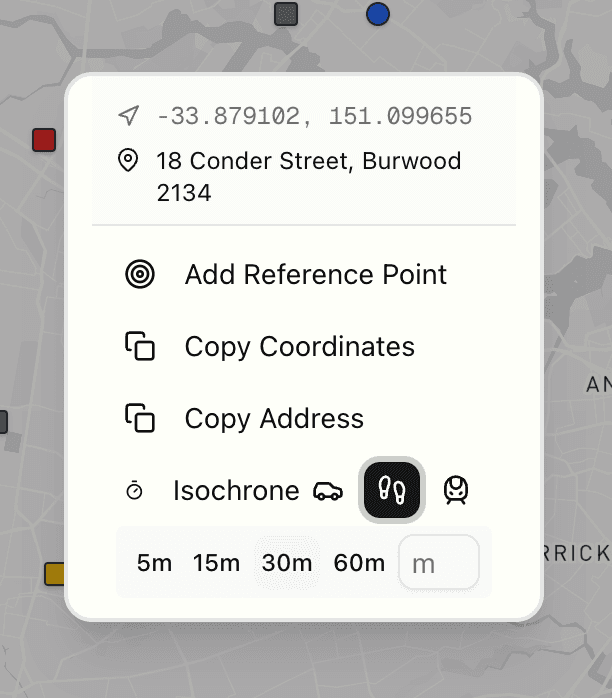
Coordinates Display
The latitude and longitude of the clicked location are shown at the top of the menu.
Address Display
The approximate street address of the clicked location is shown (reverse geocoded).
Add Reference Point
Opens a dialog to create a new reference point at the clicked location with the address pre-filled.
Copy Coordinates
Copies the latitude and longitude to the clipboard.
Copy Address
Copies the street address to the clipboard.
Isochrone
Generates an isochrone from the clicked location. Transport mode icons (car, walking, transit) and time options (5m, 15m, 30m, 60m, or custom) can be selected directly from the menu.
Markers
Property Markers
Square markers represent properties. The colour indicates the property status (see Legend). Clicking a marker opens the property report in the right sidebar and centres the map on the property.
Reference Point Markers
Circular markers represent reference points. The colour indicates the category (green=Family, blue=Friends, orange=Work, grey=Other). Clicking a marker shows a popup with the name and options to edit or delete.
Right Sidebar Panels
Map Controls
The map controls panel displays real-time information about the current map view.
Coordinates
Shows the current centre point of the map as latitude and longitude values (4 decimal places).
Zoom Level
Displays the current zoom level of the map.
Bearing
Shows the current rotation angle of the map in degrees (0° = north).
Legend
The legend panel explains the meaning of colours and symbols used on the map.
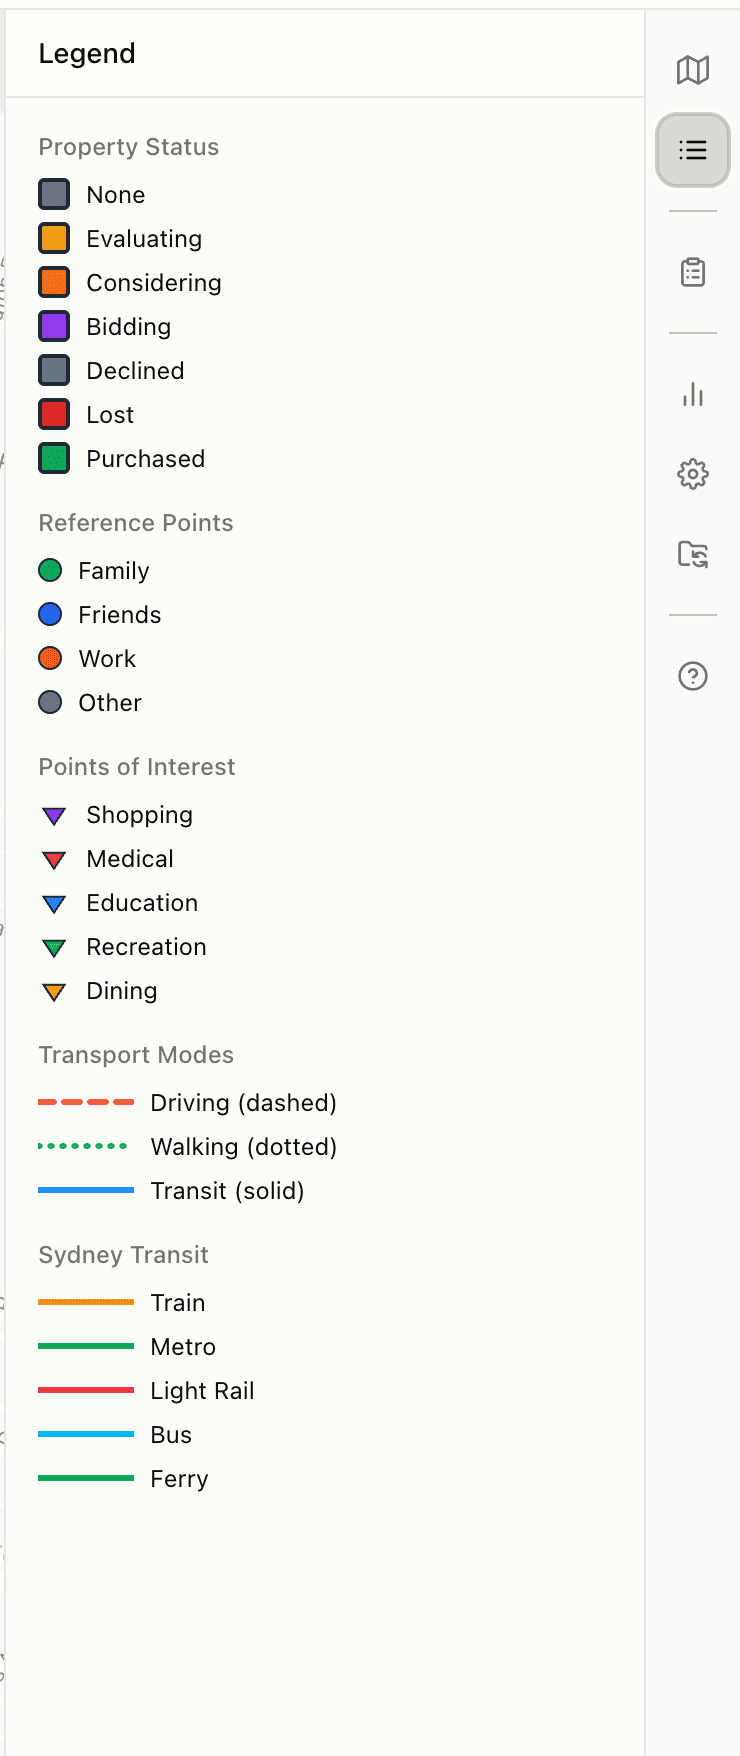
Property Status
Square markers on the map indicate properties. The colour shows the current status:
Reference Point Categories
Circular markers indicate reference points:
Points of Interest
Triangle markers (pointing down) indicate POIs:
Property Report
The property report panel displays detailed information about the selected property.
When a property is selected (by clicking its marker on the map or from the property list), the report is displayed here.
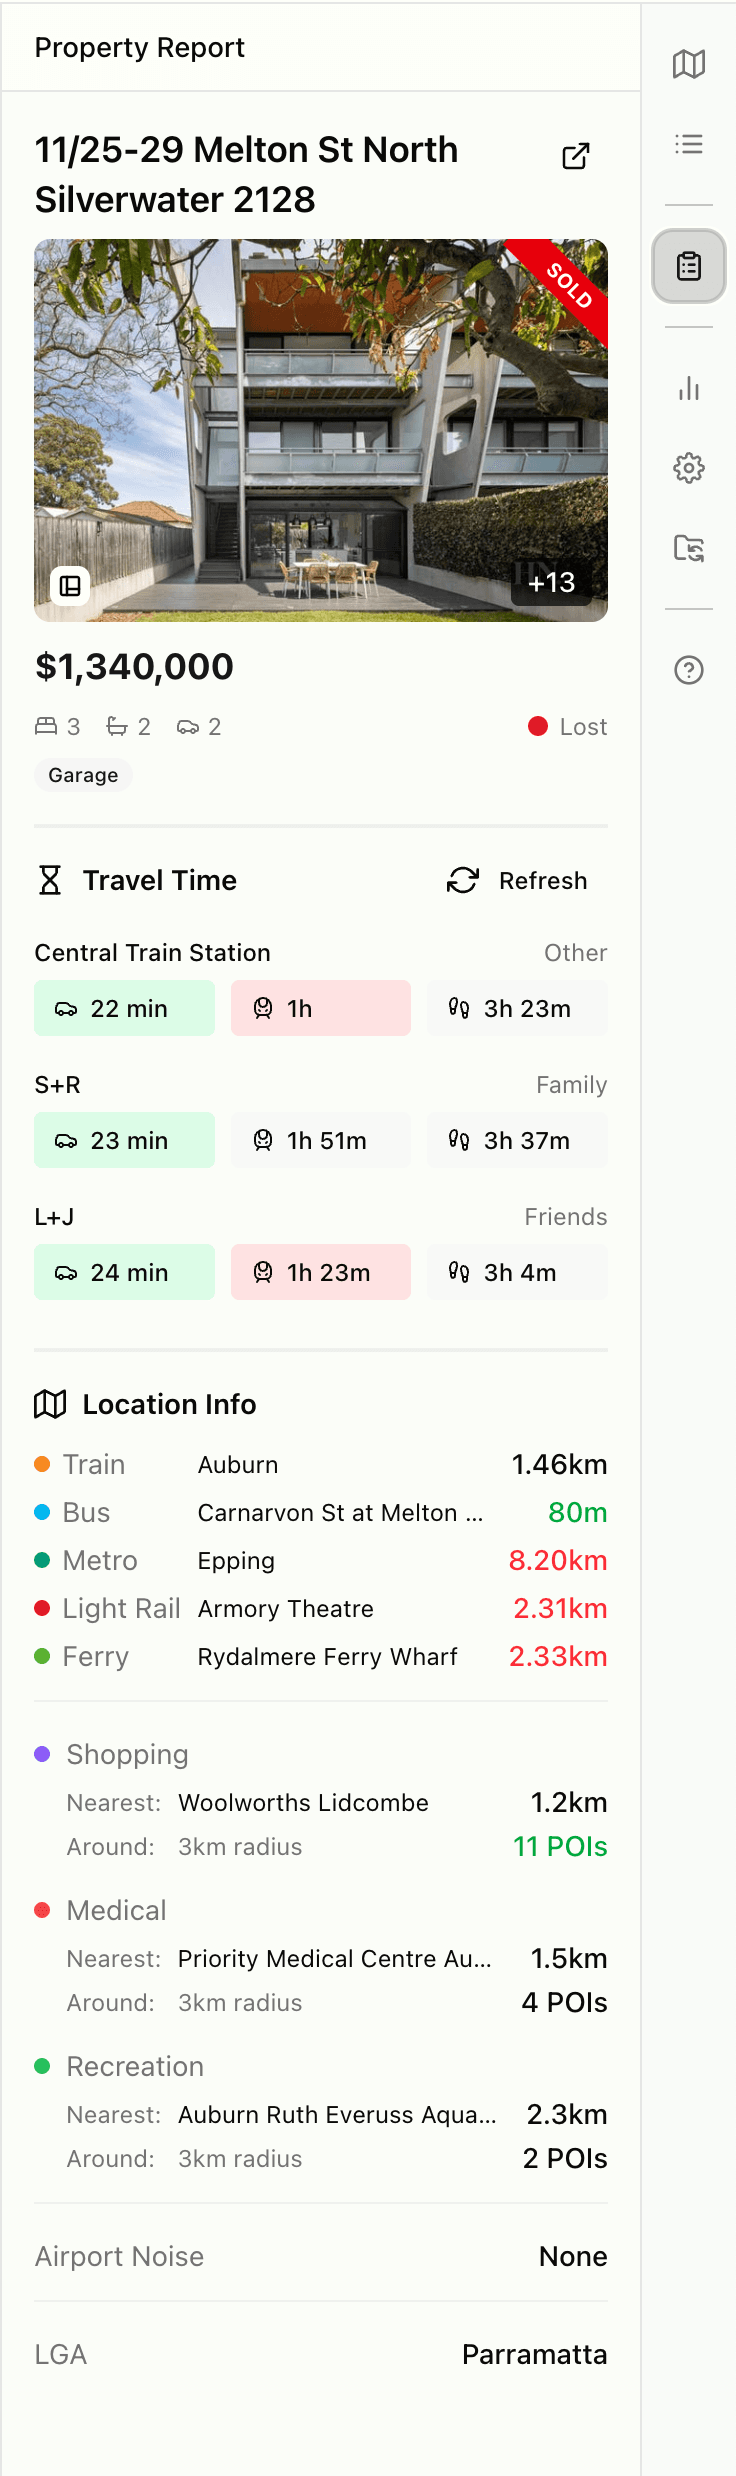
Address & Link
The property address is shown with a link icon that opens the original listing on Domain.com.au.
Image Gallery
The main property photo is displayed. A '+N' badge shows how many additional images are available. Clicking opens a lightbox gallery. The floorplan button (bottom-left) opens the floorplan if available. A 'SOLD' banner appears on sold properties.
Price
The listing price is displayed prominently below the image.
Property Specs
Bedrooms, bathrooms, and car spaces are shown with icons. Property type (e.g., 'Garage') is shown below.
Status Badge
The current property status is shown with a coloured dot (e.g., 'Lost', 'Evaluating').
Travel Time Section
Travel Times
A table shows travel times from this property to each active reference point. Three modes are shown: driving (car icon), walking (person icon), and transit (train icon).
Refresh
Recalculates travel times for all reference points.
Requirement Indicators
If a reference point has travel time requirements set, times within the requirement are shown in green, and times exceeding the requirement are shown in red.
Location Info Section
Nearby Transit
Lists the nearest station/stop for each transport type (Train, Bus, Metro, Light Rail, Ferry) with distances.
Nearby Amenities
Shows the nearest and count of POIs within the search radius for each category (Shopping, Medical, Recreation).
Airport Noise
Shows the ANEI noise level if the property is within an airport noise contour, or 'None' if outside.
LGA
Shows which Local Government Area the property is located in.
Analytics
The analytics panel will provide insights and statistics about saved properties.
This feature is coming soon.
Settings
The settings panel allows customisation of application behaviour and defaults.
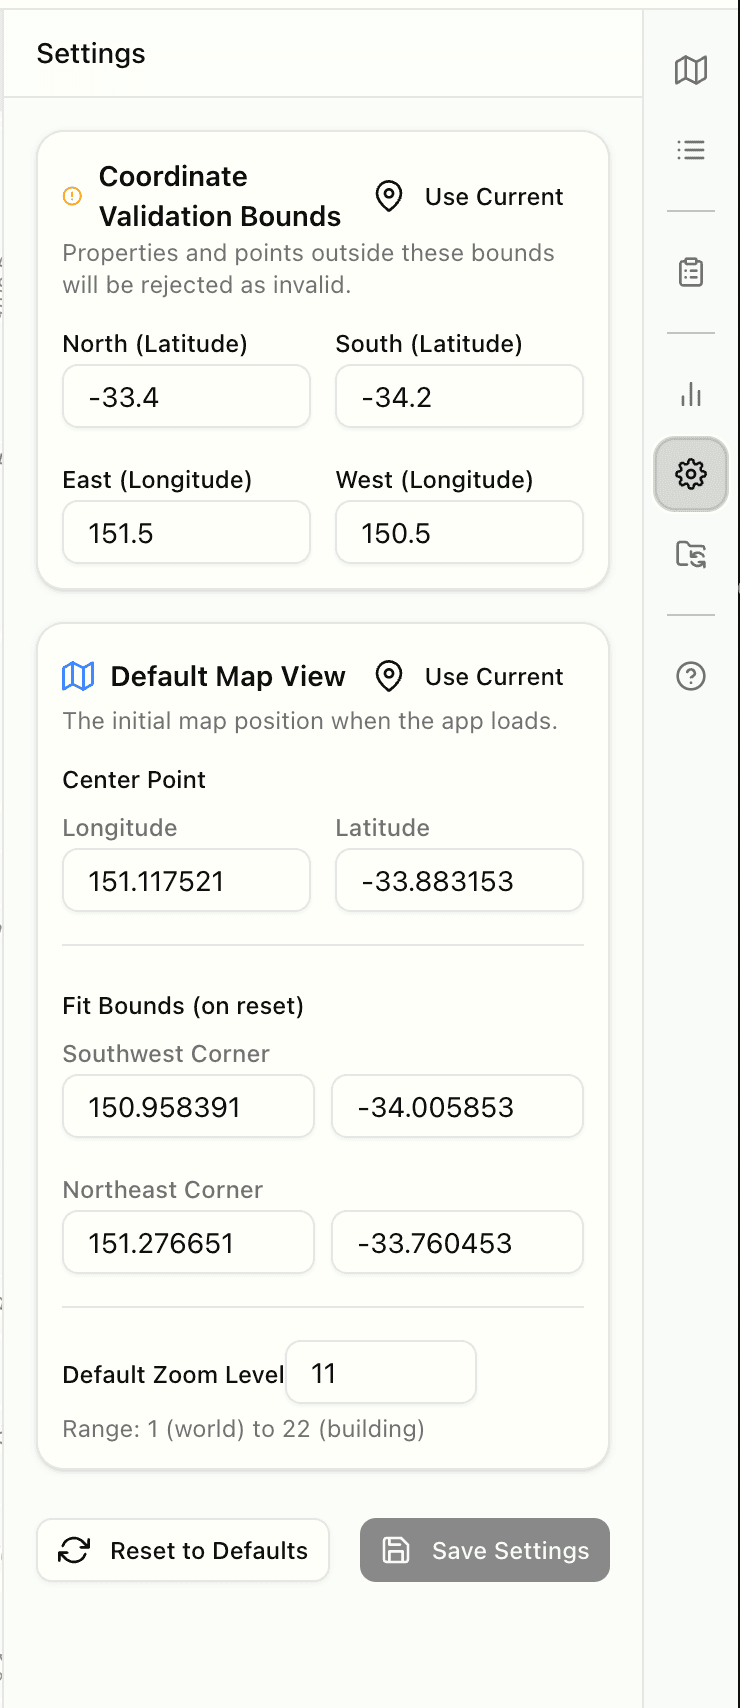
Coordinate Validation Bounds
Boundary Fields
North and South latitude, East and West longitude values define the valid area. Properties and reference points with coordinates outside these bounds will be rejected when adding.
Use Current
Captures the current map view's boundaries and fills in the coordinate fields.
Default Map View
Center Point
The longitude and latitude where the map centres when the app loads.
Fit Bounds (on reset)
Southwest and Northeast corners that define the area shown when resetting the view.
Default Zoom Level
The initial zoom level (1 = world view, 22 = building level).
Use Current
Saves the current map position, bounds, and zoom as the defaults.
Reset to Defaults
Resets all settings to their original values. Requires confirmation.
Save Settings
Saves the current settings. The button is only enabled when changes have been made.
Import/Export
The import/export panel provides backup and restore functionality for all data.
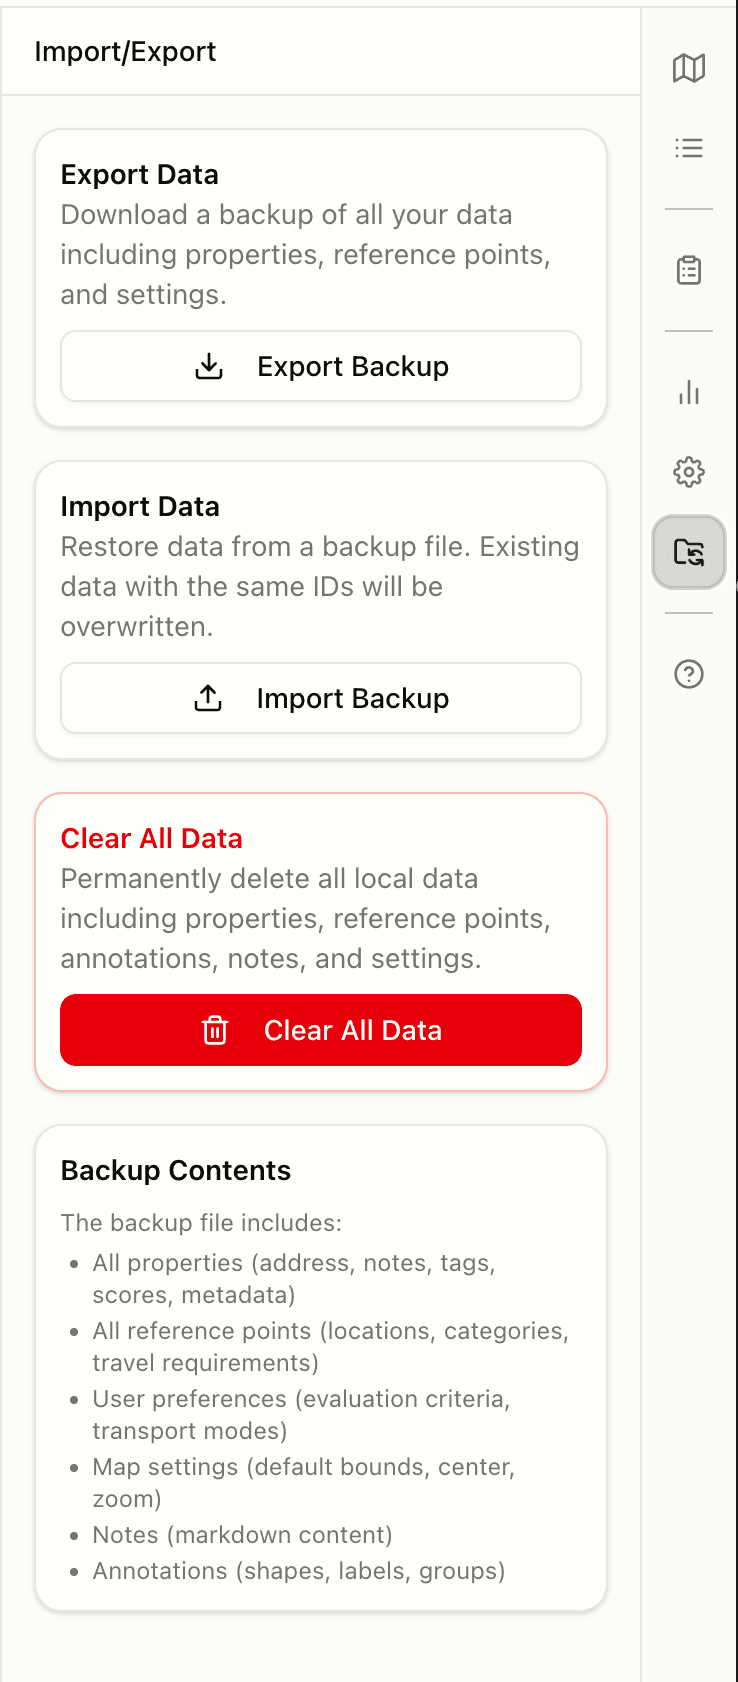
Export Backup
Downloads a JSON file containing all data. The backup includes: all properties (address, notes, tags, scores), all reference points (locations, categories, travel requirements), user preferences, map settings, notes content, and annotations.
Import Backup
Uploads a previously exported JSON file to restore data. The file is validated for compatibility. Existing data with matching IDs will be overwritten.
Clear All Data
Permanently deletes all local data including properties, reference points, annotations, notes, and settings. This action cannot be undone and requires confirmation.
Compare Page
The compare page allows multiple property reports to be viewed side by side. This is useful for directly comparing property details, prices, and travel times.
Accessing Compare
Navigate to /compare?ids=id1,id2,id3 with the property IDs to compare. Property IDs can be found in the export backup file.
Reorder Properties
Property cards can be dragged and dropped horizontally to reorder them for easier comparison.